小编给大家分享一下Python如何绘制股票移动均线,希望大家阅读完这篇文章之后都有所收获,下面让我们一起去探讨吧!
1. 前沿
移动均线是股票最进本的指标,本文采用numpy.convolve计算股票的移动均线
2. numpy.convolve
numpy.convolve(a, v, mode='full')
Returns the discrete, linear convolution of two one-dimensional sequences.
The convolution operator is often seen in signal processing, where it models the effect of a linear time-invariant system on a signal [R17]. In probability theory, the sum of two independent random variables is distributed according to the convolution of their individual distributions.
If v is longer than a, the arrays are swapped before computation.
Parameters:
a : (N,) array_like

 First one-dimensional input array.

 v : (M,) array_like

 Second one-dimensional input array.

 mode : {‘full', ‘valid', ‘same'}, optional

 ‘full':

  By default, mode is ‘full'. This returns the convolution at each point of overlap, with an output shape of (N+M-1,). At the end-points of the convolution, the signals do not overlap completely, and boundary effects may be seen.
 ‘same':

  Mode same returns output of length max(M, N). Boundary effects are still visible.
 ‘valid':

Mode valid returns output of length max(M, N) - min(M, N) + 1. The convolution product is only given for points where the signals overlap completely. Values outside the signal boundary have no effect.Returns:
out : ndarray
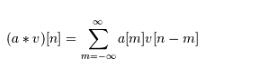
Discrete, linear convolution of a and v.计算公式:
eg:
>>> import numpy as np
>>>
>>> np_list = np.array([1, 2, 3, 4, 5, 6, 7, 8, 9])
>>>
>>> np_list
array([1, 2, 3, 4, 5, 6, 7, 8, 9])
>>> x = np.convolve(np_list, 2)
>>> x
array([ 2, 4, 6, 8, 10, 12, 14, 16, 18])
>>> x = np.convolve(np_list, [0.5, 0.5])
>>> x
array([ 0.5, 1.5, 2.5, 3.5, 4.5, 5.5, 6.5, 7.5, 8.5, 4.5])3. 移动均线计算
def moving_average(x, n, type='simple'):
 x = np.asarray(x)
 if type == 'simple':
  weights = np.ones(n)
 else:
  weights = np.exp(np.linspace(-1., 0., n))

 weights /= weights.sum()

 a = np.convolve(x, weights, mode='full')[:len(x)]
 a[:n] = a[n]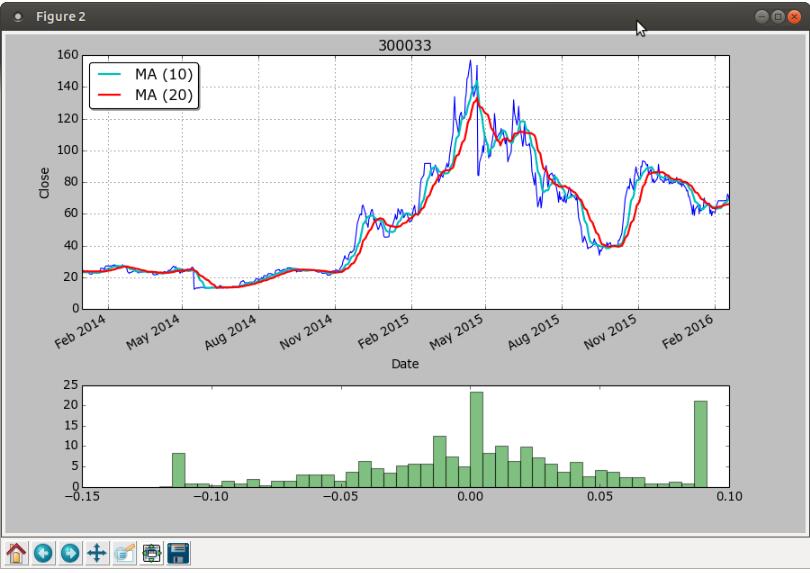
return a ma10 = moving_average(close_data, 10, 'simple')
ma20 = moving_average(close_data, 20, 'simple')
ax1.plot(data['date'], ma10, color='c', lw=2, label='MA (10)')
ax1.plot(data['date'], ma20, color='red', lw=2, label='MA (20)')4. 效果图
Python是一种跨平台的、具有解释性、编译性、互动性和面向对象的脚本语言,其最初的设计是用于编写自动化脚本,随着版本的不断更新和新功能的添加,常用于用于开发独立的项目和大型项目。
看完了这篇文章,相信你对“Python如何绘制股票移动均线”有了一定的了解,如果想了解更多相关知识,欢迎关注亿速云行业资讯频道,感谢各位的阅读!
亿速云「云服务器」,即开即用、新一代英特尔至强铂金CPU、三副本存储NVMe SSD云盘,价格低至29元/月。点击查看>>
免责声明:本站发布的内容(图片、视频和文字)以原创、转载和分享为主,文章观点不代表本网站立场,如果涉及侵权请联系站长邮箱:is@yisu.com进行举报,并提供相关证据,一经查实,将立刻删除涉嫌侵权内容。


 计算
计算 安全
安全 数据库
数据库 网络和加速
网络和加速 企业服务
企业服务


