1.正态分布简介
正态分布(normal distribtution)又叫做高斯分布(Gaussian distribution),是一个非常重要也非常常见的连续概率分布。正态分布大家也都非常熟悉,下面做一些简单的介绍。
假设随机变量XX服从一个位置参数为μμ、尺度参数为σσ的正态分布,则可以记为:

而概率密度函数为

2.在python中画正态分布直方图
先直接上代码
import numpy as np
import matplotlib.mlab as mlab
import matplotlib.pyplot as plt


def demo1():
  mu ,sigma = 0, 1
  sampleNo = 1000
  np.random.seed(0)
  s = np.random.normal(mu, sigma, sampleNo)

  plt.hist(s, bins=100, normed=True)
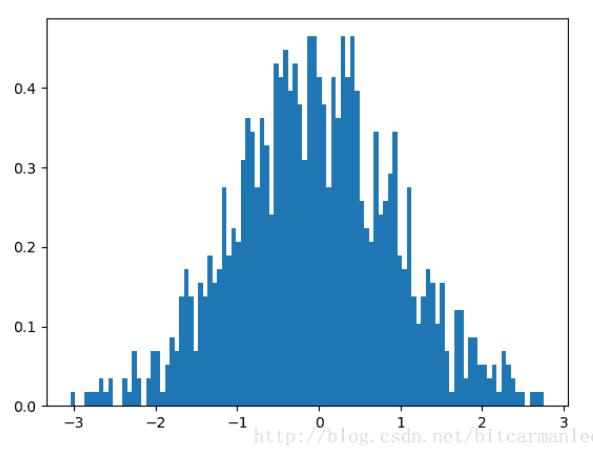
plt.show()上面是一个标准正态分布的直方图。最后输出的图像为:

很多同学心里会有疑惑:这个图像看上去虽然是有点奇怪,虽然形状有点像正态分布,但是差得还比较多嘛,不能算是严格意义上的正态分布。
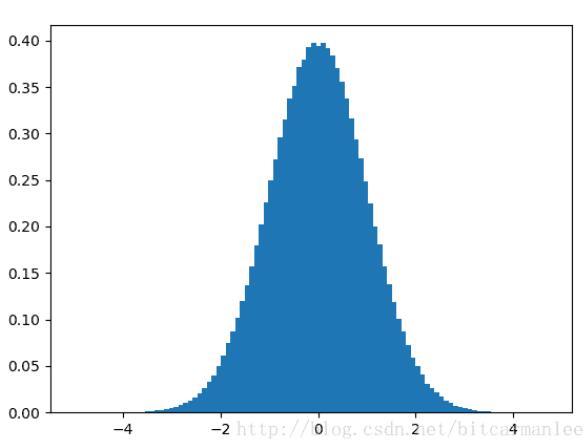
为什么会有这种情况出现呢?其实原因很简单,代码中我们设定的smapleno = 1000。这个数量并不是很大,所以整个图像看起来分布并不是很规则,只是有大致的正态分布的趋势。如果我们将这个参数加大,相当于增加样本数量,那么整个图像就会更加接近正态分布的形状。跟抛硬币的原理一致,抛的次数越多,正面与反面的出现概率更接近50%。
如果我们将sampleno设置为1000000,分布图像如下。

下面这个图像是不是看起来就漂亮多了!
3.画直方图与概率分布曲线
import numpy as np
import matplotlib.mlab as mlab
import matplotlib.pyplot as plt

def demo2():
  mu, sigma , num_bins = 0, 1, 50
  x = mu + sigma * np.random.randn(1000000)
  # 正态分布的数据
  n, bins, patches = plt.hist(x, num_bins, normed=True, facecolor = 'blue', alpha = 0.5)
  # 拟合曲线
  y = mlab.normpdf(bins, mu, sigma)
  plt.plot(bins, y, 'r--')
  plt.xlabel('Expectation')
  plt.ylabel('Probability')
  plt.title('histogram of normal distribution: $\mu = 0$, $\sigma=1$')

  plt.subplots_adjust(left = 0.15)
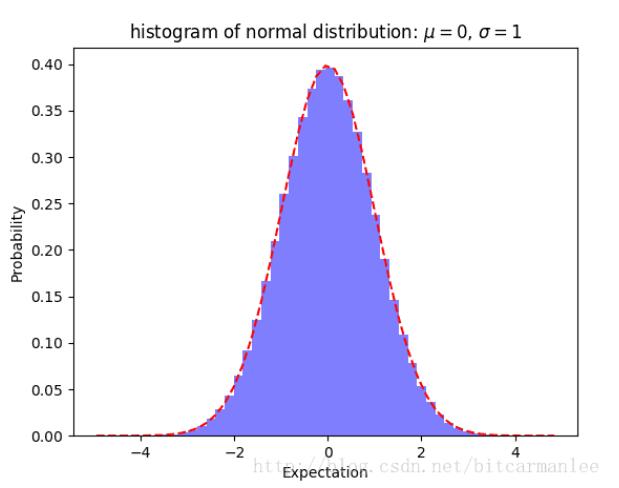
plt.show()最后得到的图像为:

以上这篇在python中画正态分布图像的实例就是小编分享给大家的全部内容了,希望能给大家一个参考,也希望大家多多支持亿速云。
亿速云「云服务器」,即开即用、新一代英特尔至强铂金CPU、三副本存储NVMe SSD云盘,价格低至29元/月。点击查看>>
免责声明:本站发布的内容(图片、视频和文字)以原创、转载和分享为主,文章观点不代表本网站立场,如果涉及侵权请联系站长邮箱:is@yisu.com进行举报,并提供相关证据,一经查实,将立刻删除涉嫌侵权内容。