今天就跟大家聊聊有关怎么在Python中使用pylab库绘制直方图,可能很多人都不太了解,为了让大家更加了解,小编给大家总结了以下内容,希望大家根据这篇文章可以有所收获。
Python直方图
#!/usr/bin/python
# -*- coding: utf-8 -*-
import pylab as pl
dataFile = "dataList.txt"
tempList = []
with open(dataFile,"r") as data:
  for everLine in data:
    arrEverLine = [float(index) for index in everLine.split()]
    tempList.append(arrEverLine[0])
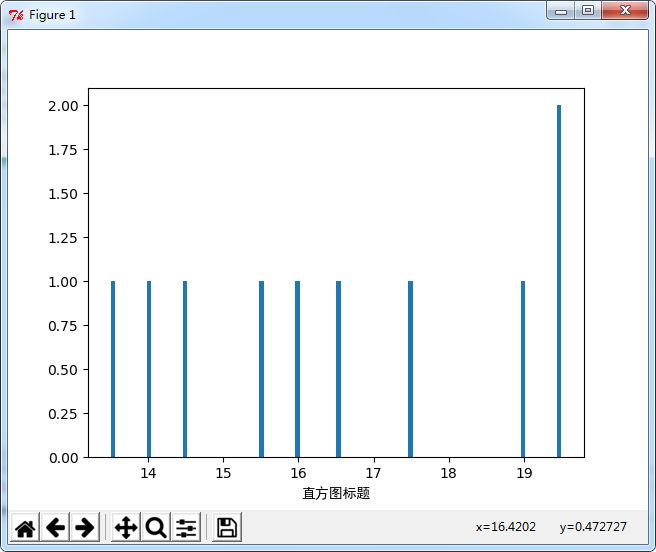
pl.hist(tempList,100)
pl.xlabel("直方图标题", fontproperties='SimHei')
pl.show()dataList.txt内容
14 2 1 0.5 0.5 0 1 0.5 1.5 18.5
19 2 2 0.5 1 0 1 0.5 0 21
19.5 2 1.5 2 0 0.5 2 0 1 20
17.5 1.5 1 1.5 2 0 1.5 0 0 18.5
19.5 2 2 2 0.5 0 1 0 0.5 19.5
16.5 2 0.5 1 0 0.5 0.5 0 0.5 19.5
15.5 2 1 1.5 0 0 1 0.5 1 17.5
13.5 1.5 1 1 2 0 2 0.5 2 20
14.5 2 1.5 2 0 0 1 0 2 18.5
16 2 2 1.5 1 0.5 1 0 2 19.5
。。。
输出结果

看完上述内容,你们对怎么在Python中使用pylab库绘制直方图有进一步的了解吗?如果还想了解更多知识或者相关内容,请关注亿速云行业资讯频道,感谢大家的支持。
亿速云「云服务器」,即开即用、新一代英特尔至强铂金CPU、三副本存储NVMe SSD云盘,价格低至29元/月。点击查看>>
免责声明:本站发布的内容(图片、视频和文字)以原创、转载和分享为主,文章观点不代表本网站立场,如果涉及侵权请联系站长邮箱:is@yisu.com进行举报,并提供相关证据,一经查实,将立刻删除涉嫌侵权内容。