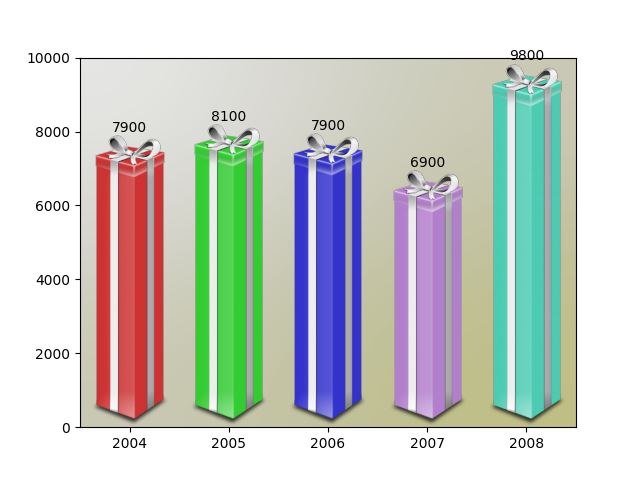
小编给大家分享一下python+matplotlib如何实现礼盒柱状图,相信大部分人都还不怎么了解,因此分享这篇文章给大家参考一下,希望大家阅读完这篇文章后大有收获,下面让我们一起去了解一下吧!
演示结果:

完整代码:
import matplotlib.pyplot as plt
import numpy as np
from matplotlib.image import BboxImage

from matplotlib._png import read_png
import matplotlib.colors
from matplotlib.cbook import get_sample_data


class RibbonBox(object):

  original_image = read_png(get_sample_data("Minduka_Present_Blue_Pack.png",
                       asfileobj=False))
  cut_location = 70
  b_and_h = original_image[:, :, 2]
  color = original_image[:, :, 2] - original_image[:, :, 0]
  alpha = original_image[:, :, 3]
  nx = original_image.shape[1]

  def __init__(self, color):
    rgb = matplotlib.colors.to_rgba(color)[:3]

    im = np.empty(self.original_image.shape,
           self.original_image.dtype)

    im[:, :, :3] = self.b_and_h[:, :, np.newaxis]
    im[:, :, :3] -= self.color[:, :, np.newaxis]*(1. - np.array(rgb))
    im[:, :, 3] = self.alpha

    self.im = im

  def get_stretched_image(self, stretch_factor):
    stretch_factor = max(stretch_factor, 1)
    ny, nx, nch = self.im.shape
    ny2 = int(ny*stretch_factor)

    stretched_image = np.empty((ny2, nx, nch),
                  self.im.dtype)
    cut = self.im[self.cut_location, :, :]
    stretched_image[:, :, :] = cut
    stretched_image[:self.cut_location, :, :] = \
      self.im[:self.cut_location, :, :]
    stretched_image[-(ny - self.cut_location):, :, :] = \
      self.im[-(ny - self.cut_location):, :, :]

    self._cached_im = stretched_image
    return stretched_image


class RibbonBoxImage(BboxImage):
  zorder = 1

  def __init__(self, bbox, color,
         cmap=None,
         norm=None,
         interpolation=None,
         origin=None,
         filternorm=1,
         filterrad=4.0,
         resample=False,
         **kwargs
         ):

    BboxImage.__init__(self, bbox,
              cmap=cmap,
              norm=norm,
              interpolation=interpolation,
              origin=origin,
              filternorm=filternorm,
              filterrad=filterrad,
              resample=resample,
              **kwargs
              )

    self._ribbonbox = RibbonBox(color)
    self._cached_ny = None

  def draw(self, renderer, *args, **kwargs):

    bbox = self.get_window_extent(renderer)
    stretch_factor = bbox.height / bbox.width

    ny = int(stretch_factor*self._ribbonbox.nx)
    if self._cached_ny != ny:
      arr = self._ribbonbox.get_stretched_image(stretch_factor)
      self.set_array(arr)
      self._cached_ny = ny

    BboxImage.draw(self, renderer, *args, **kwargs)


if 1:
  from matplotlib.transforms import Bbox, TransformedBbox
  from matplotlib.ticker import ScalarFormatter

  # Fixing random state for reproducibility
  np.random.seed(19680801)

  fig, ax = plt.subplots()

  years = np.arange(2004, 2009)
  box_colors = [(0.8, 0.2, 0.2),
         (0.2, 0.8, 0.2),
         (0.2, 0.2, 0.8),
         (0.7, 0.5, 0.8),
         (0.3, 0.8, 0.7),
         ]
  heights = np.random.random(years.shape) * 7000 + 3000

  fmt = ScalarFormatter(useOffset=False)
  ax.xaxis.set_major_formatter(fmt)

  for year, h, bc in zip(years, heights, box_colors):
    bbox0 = Bbox.from_extents(year - 0.4, 0., year + 0.4, h)
    bbox = TransformedBbox(bbox0, ax.transData)
    rb_patch = RibbonBoxImage(bbox, bc, interpolation="bicubic")

    ax.add_artist(rb_patch)

    ax.annotate(r"%d" % (int(h/100.)*100),
          (year, h), va="bottom", ha="center")

  patch_gradient = BboxImage(ax.bbox,
                interpolation="bicubic",
                zorder=0.1,
                )
  gradient = np.zeros((2, 2, 4), dtype=float)
  gradient[:, :, :3] = [1, 1, 0.]
  gradient[:, :, 3] = [[0.1, 0.3], [0.3, 0.5]] # alpha channel
  patch_gradient.set_array(gradient)
  ax.add_artist(patch_gradient)

  ax.set_xlim(years[0] - 0.5, years[-1] + 0.5)
  ax.set_ylim(0, 10000)

  fig.savefig('ribbon_box.png')
  plt.show()
以上是“python+matplotlib如何实现礼盒柱状图”这篇文章的所有内容,感谢各位的阅读!相信大家都有了一定的了解,希望分享的内容对大家有所帮助,如果还想学习更多知识,欢迎关注亿速云行业资讯频道!
免责声明:本站发布的内容(图片、视频和文字)以原创、转载和分享为主,文章观点不代表本网站立场,如果涉及侵权请联系站长邮箱:is@yisu.com进行举报,并提供相关证据,一经查实,将立刻删除涉嫌侵权内容。