使用Java怎么在PPT中添加混合图表,针对这个问题,这篇文章详细介绍了相对应的分析和解答,希望可以帮助更多想解决这个问题的小伙伴找到更简单易行的方法。
Jar文件获取及导入:
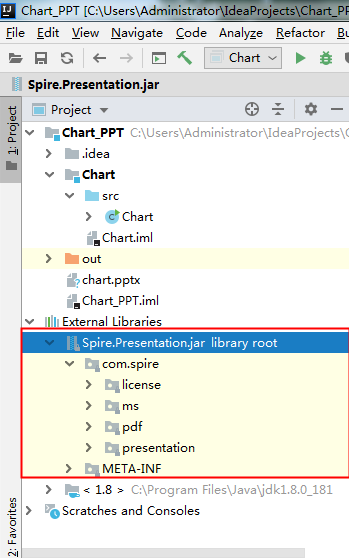
方法1:通过官网下载jar文件包。下载后,解压文件,并将lib文件夹下的Spire.Presentation.jar导入java程序。参考如下导入效果:
方法2:通过maven仓库安装导入。可参考导入方法。
Java代码示例(供参考)
import com.spire.presentation.*;
import com.spire.presentation.charts.ChartType;
import com.spire.presentation.charts.IChart;
import com.spire.presentation.drawing.FillFormatType;
import java.awt.geom.Rectangle2D;
public class Chart {
  public static void main(String[] args) throws Exception{
    //创建PowerPoint文档
    Presentation presentation = new Presentation();

    //添加一个柱状图
    Rectangle2D.Double rect = new  Rectangle2D.Double(60, 100, 600, 350);
    IChart chart = presentation.getSlides().get(0).getShapes().appendChart(ChartType.COLUMN_CLUSTERED, rect);

    //设置图表名称
    chart.getChartTitle().getTextProperties().setText("上半年销量");
    chart.getChartTitle().getTextProperties().isCentered(true);
    chart.getChartTitle().setHeight(30);
    chart.hasTitle(true);

    //写入图表数据
    chart.getChartData().get(0,0).setText("月份");
    chart.getChartData().get(0,1).setText("销量");
    chart.getChartData().get(0,2).setText("环比增长(%)");
    chart.getChartData().get(1,0).setText("1月");
    chart.getChartData().get(1,1).setNumberValue(120);
    chart.getChartData().get(1,2).setNumberValue(12);
    chart.getChartData().get(2,0).setText("2月");
    chart.getChartData().get(2,1).setNumberValue(100);
    chart.getChartData().get(2,2).setNumberValue(10);
    chart.getChartData().get(3,0).setText("3月");
    chart.getChartData().get(3,1).setNumberValue(80);
    chart.getChartData().get(3,2).setNumberValue(9);
    chart.getChartData().get(4,0).setText("4月");
    chart.getChartData().get(4,1).setNumberValue(120);
    chart.getChartData().get(4,2).setNumberValue(15);
    chart.getChartData().get(5,0).setText("5月");
    chart.getChartData().get(5,1).setNumberValue(90);
    chart.getChartData().get(5,2).setNumberValue(11);
    chart.getChartData().get(6,0).setText("6月");
    chart.getChartData().get(6,1).setNumberValue(110);
    chart.getChartData().get(6,2).setNumberValue(10.5);

    //设置系列标签数据来源
    chart.getSeries().setSeriesLabel(chart.getChartData().get("B1", "C1"));

    //设置分类标签数据来源
    chart.getCategories().setCategoryLabels(chart.getChartData().get("A2", "A7"));

    //设置系列的数据来源
    chart.getSeries().get(0).setValues(chart.getChartData().get("B2", "B7"));
    chart.getSeries().get(1).setValues(chart.getChartData().get("C2", "C7"));
    chart.getSeries().get(1).getDataLabels().setLabelValueVisible(true);//设置显示系列2的数据标签值
    chart.getSeries().get(1).setType(ChartType.LINE_MARKERS);//将系列2的图表类型设置为折线图
    chart.getSeries().get(1).setUseSecondAxis(true);//将系列2绘制在次坐标轴
    chart.getSecondaryValueAxis().getMajorGridTextLines().setFillType(FillFormatType.NONE);//不显示次坐标轴的网格线

    //设置系列重叠
    chart.setOverLap(-30);

    //设置分类间距
    chart.setGapDepth(200);

    //保存文档
    presentation.saveToFile("chart.pptx", FileFormat.PPTX_2013);
    presentation.dispose();
  }
}图表添加效果:

关于使用Java怎么在PPT中添加混合图表问题的解答就分享到这里了,希望以上内容可以对大家有一定的帮助,如果你还有很多疑惑没有解开,可以关注亿速云行业资讯频道了解更多相关知识。
亿速云「云服务器」,即开即用、新一代英特尔至强铂金CPU、三副本存储NVMe SSD云盘,价格低至29元/月。点击查看>>
免责声明:本站发布的内容(图片、视频和文字)以原创、转载和分享为主,文章观点不代表本网站立场,如果涉及侵权请联系站长邮箱:is@yisu.com进行举报,并提供相关证据,一经查实,将立刻删除涉嫌侵权内容。


 计算
计算 安全
安全 数据库
数据库 网络和加速
网络和加速 企业服务
企业服务


