下文我给大家简单讲讲关于tpcc-mysql专用于MySQL基准测试教程,大家之前了解过相关类似主题内容吗?感兴趣的话就一起来看看这篇文章吧,相信看完tpcc-mysql专用于MySQL基准测试教程对大家多少有点帮助吧。
安装
下载安装epel:
wget http://dl.fedoraproject.org/pub/epel/6/x86_64/epel-release-6-8.noarch.rpm
rpm -ivh epel-release-6-8.noarch.rpm
安装bzr客户端:
yum install -y bzr
下载tpcc-mysql-master.zip软件:
https://github.com/Percona-Lab/tpcc-mysql
unzip tpcc-mysql-master.zip
cd tpcc-mysql-master/src/
make
如果 make 编译没有报错,就会在 /tmp/tpcc-mysql 下生成 tpcc 二进制命令行工具 tpcc_load 、 tpcc_start;
Tpcc工具结构介绍
create_table.sql:创建所需的数据库表,共9个表
add_fkey_idx.sql:创建索引和外键
drop_cons.sql:删除约束
这9个表的关系:
customer district history item new_orders order_line orders stock warehouse
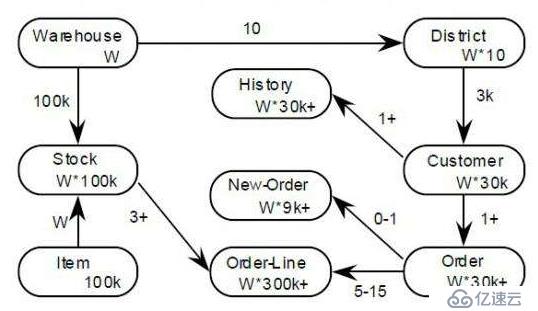
tpcc-mysql的业务逻辑及其相关的几个表作用如下:
New-Order:新订单,一次完整的订单事务,几乎涉及到全部表
Payment:支付,主要对应 orders、history 表
Order-Status:订单状态,主要对应 orders、order_line 表
Delivery:发货,主要对应 order_line 表
Stock-Level:库存,主要对应 stock 表
其他相关表:
客户:主要对应 customer 表
地区:主要对应 district 表
商品:主要对应 item 表
仓库:主要对应warehouse 表
测试步骤
(1)建库建表
mysqladmin -uroot -p147258 create tpccdb;
mysql -uroot -p147258 tpccdb < /tmp/tpcc-mysql-master/create_table.sql
mysql -uroot -p147258 tpccdb < /tmp/tpcc-mysql-master/add_fkey_idx.sql --这一步也可以在加载数据之后做;
(2)填充数据
如:向tpccdb库压测100个仓库数量:
./tpcc_load -hlocalhost -dtpccdb -uroot -p147258 -w100
【NOTE】选项 warehouse为测试库下的仓库数量,真实测试场景中,仓库数一般不建议少于100个,视云服务器硬件配置而定,如果是配备了SSD或者PCie SSD这种高IOPS设备的话,建议最少不低于1000个。
补充tpcc_load的参数:
tpcc_load -h server_host -P port -d database_name -u mysql_user -p mysql_password -w warehouses -l part -m min_wh -n max_wh
-h 指定主机名
-P 指定mysql端口
-d 指定库名
-u 指定用户
-p 指定密码
-w 指定仓库数
-l 指定* [part]: 1=ITEMS 2=WAREHOUSE 3=CUSTOMER 4=ORDERS
-m 指定最小warehouse
-n 指定最大warehouse
(3)开始测试
如:指定仓库1000,并发数32,预热120s,测试持续1h;
tpcc_start -hlocalhost -d tpccdb -u root -p "147258" -w 1000 -c 32 -r 120 -l 3600 -f tpcc_mysql_20140921.log >>tpcc_caseX_20140921.log 2>&1
【NOTE】真实测试场景中,建议预热时间不小于5分钟,持续压测时长不小于30分钟,否则测试数据可能不具参考意义。
补充tpcc_start的用法:
tpcc_start -h server_host -P port -d database_name -u mysql_user -p mysql_password -w warehouses -c connections -r warmup_time -l running_time -i report_interval -f report_file -t trx_file
-w 指定仓库数量;
-c 指定并发连接数,默认是1;
-r 指定开始测试前进行warmup的时间,单位s;
-l 指定测试持续时间,单位s;
-i 指定生成报告间隔时长
-f 指定生成的报告文件名
TPCC结果解读
output注释:
10, trx: 12920, 95%: 9.483, 99%: 18.738, max_rt: 213.169, 12919|98.778, 1292|101.096, 1293|443.955, 1293|670.842
20, trx: 12666, 95%: 7.074, 99%: 15.578, max_rt: 53.733, 12668|50.420, 1267|35.846, 1266|58.292, 1267|37.421
30, trx: 13269, 95%: 6.806, 99%: 13.126, max_rt: 41.425, 13267|27.968, 1327|32.242, 1327|40.529, 1327|29.580
40, trx: 12721, 95%: 7.265, 99%: 15.223, max_rt: 60.368, 12721|42.837, 1271|34.567, 1272|64.284, 1272|22.947
50, trx: 12573, 95%: 7.185, 99%: 14.624, max_rt: 48.607, 12573|45.345, 1258|41.104, 1258|54.022, 1257|26.626
--10 - the seconds from the start of the benchmark
(每隔10s统计 )
--trx: 12920 - New Order transactions executed during the gived interval (in this case, for the previous 10 sec). Basically this is the --throughput per interval. The more the better
(在10s内新订单事物数,该值越大说明性能越好)
--95%: 9.483: - The 95% Response time of New Order transactions per given interval. In this case it is 9.483 sec
(每个给定区间的新订单事务的95%响应时间)
--99%: 18.738: - The 99% Response time of New Order transactions per given interval. In this case it is 18.738 sec
(每个给定区间的新订单事务的99%响应时间)
--max_rt: 213.169: - The Max Response time of New Order transactions per given interval. In this case it is 213.169 sec
(新订单事物最大响应的时间 )
--the rest: 12919|98.778, 1292|101.096, 1293|443.955, 1293|670.842 is throughput and max response time for the other kind of transactions and can be ignored
(其他事物数和最大响应时间)
开始压测指定仓库10个,并发32个,预热10s,持续120s,每隔10s生成报告,并生成日志文件tpccdb20170315.log:
(这里的测试是自己的虚拟机,硬件配置不太好,所以测试参数没有设置过大,只是为了能有个结果供我们学习分析,不具有参考意义)

[root@Darren1 tpcc-mysql-master]# ./tpcc_start -S /tmp/mysql.sock -hlocalhost -dtpccdb -uroot -p147258 -w10 -c32 -r10 -l120 -ftpccdb20170315.log
***************************************
*** ###easy### TPC-C Load Generator ***
***************************************
option S (socket) with value '/tmp/mysql.sock'
option h with value 'localhost'
option d with value 'tpccdb'
option u with value 'root'
option p with value '147258'
option w with value '10'
option c with value '32'
option r with value '10'
option l with value '120'
option f with value 'tpccdb20170315.log'
<Parameters>
     [server]: localhost
     [port]: 3306
     [DBname]: tpccdb
       [user]: root
       [pass]: 147258
  [warehouse]: 10
 [connection]: 32
     [rampup]: 10 (sec.)     --预热时长
    [measure]: 120 (sec.)     --测试时长
RAMP-UP TIME.(10 sec.)             --预热结束
MEASURING START.              --测试开始
  10, trx: 13, 95%: 15137.766, 99%: 18323.255, max_rt: 18325.580, 14|13748.201, 0|1574.186, 0|0.000, 0|0.000
  20, trx: 13, 95%: 21680.204, 99%: 22399.251, max_rt: 22399.842, 10|23612.802, 2|6979.888, 0|0.000, 0|0.000
  30, trx: 14, 95%: 21550.797, 99%: 24865.887, max_rt: 24863.416, 8|19415.285, 0|0.000, 1|34375.755, 0|0.000
  40, trx: 6, 95%: 30071.479, 99%: 30071.479, max_rt: 30070.638, 13|21700.073, 2|1556.698, 0|0.000, 0|0.000
  50, trx: 16, 95%: 16555.115, 99%: 18088.917, max_rt: 18089.462, 15|10727.610, 1|985.788, 2|44921.254, 0|0.000
  60, trx: 6, 95%: 20426.460, 99%: 20426.460, max_rt: 20427.254, 7|16342.486, 0|0.000, 0|0.000, 0|0.000
  70, trx: 7, 95%: 20840.263, 99%: 20840.263, max_rt: 20842.583, 6|17685.274, 0|0.000, 2|71371.553, 1|73601.007
  80, trx: 12, 95%: 19331.825, 99%: 21961.066, max_rt: 21963.506, 12|16032.869, 2|6187.316, 0|0.000, 0|0.000
  90, trx: 10, 95%: 14917.352, 99%: 14917.352, max_rt: 14915.321, 8|11906.947, 1|3237.487, 1|56860.851, 1|73551.862
 100, trx: 8, 95%: 19061.751, 99%: 19061.751, max_rt: 19061.873, 9|14089.579, 1|433.691, 2|54415.280, 3|106539.602
 110, trx: 16, 95%: 16076.521, 99%: 16270.171, max_rt: 16268.213, 3|11618.824, 1|92.480, 1|8790.656, 0|0.000
 120, trx: 10, 95%: 13437.587, 99%: 13437.587, max_rt: 13437.183, 22|31044.348, 1|5419.699, 2|53726.988, 0|0.000
STOPPING THREADS................................                  --结束压测
<Raw Results>                                            --第一次统计结果
  [0] sc:0 lt:131  rt:0  fl:0 avg_rt: 13862.8 (5)        --new-order,新订单业务成功次数(success),延迟次数(late),重试次数(retry),失败次数(failure),平均重试次数
  [1] sc:0 lt:127  rt:0  fl:0 avg_rt: 8024.2 (5)         --payment,支付业务统计
  [2] sc:0 lt:11  rt:0  fl:0 avg_rt: 3254.7 (5)         --order-status,订单状态业务统计
  [3] sc:0 lt:11  rt:0  fl:0 avg_rt: 56329.9 (80)        --delivery 发货业务统计
  [4] sc:0 lt:5  rt:0  fl:0 avg_rt: 208602.8 (20)        --stock-level库存业务统计
 in 120 sec.
<Raw Results2(sum ver.)>                                             --第二次测试结果
  [0] sc:0  lt:131  rt:0  fl:0
  [1] sc:0  lt:127  rt:0  fl:0
  [2] sc:0  lt:11  rt:0  fl:0
  [3] sc:0  lt:11  rt:0  fl:0
  [4] sc:0  lt:5  rt:0  fl:0
<Constraint Check> (all must be [OK])       --所有的都必须OK才行
 [transaction percentage]
        Payment: 44.56% (>=43.0%) [OK]   --支付成功次数,结果大于43%,为OK,结果小于43%,为NG;
   Order-Status: 3.86% (>= 4.0%) [NG] *    --订单状态
       Delivery: 3.86% (>= 4.0%) [NG] *  --发货状态
    Stock-Level: 1.75% (>= 4.0%) [NG] *   --库存状态
 [response time (at least 90% passed)]      --响应耗时指标必须超过90%通过才行
      New-Order: 0.00%  [NG] *       --表示not good
        Payment: 0.00%  [NG] *
   Order-Status: 0.00%  [NG] *
       Delivery: 0.00%  [NG] *
    Stock-Level: 0.00%  [NG] *
<TpmC>
65.500 TpmC --TpmC结果值(每分钟事务数,该值是第一次统计结果中的新订单事务数除以总耗时分钟数,例如本例中是:131/2=65.5),TpmC/60=tpsFAQ
安装时候的报错
[root@Darren1 tpcc-mysql-master]# ./tpcc_load help
./tpcc_load: error while loading shared libraries: libmysqlclient.so.20: cannot open shared object file: No such file or directory
解决方法:
[root@Darren1 tpcc-mysql-master]# ln -s /usr/local/mysql/lib/libmysqlclient.so.20 /usr/lib64/libmysqlclient.so.20
大家觉得tpcc-mysql专用于MySQL基准测试教程这篇文章怎么样,是否有所收获。如果想要了解更多相关,可以继续关注我们的行业资讯板块。
亿速云「云数据库 MySQL」免部署即开即用,比自行安装部署数据库高出1倍以上的性能,双节点冗余防止单节点故障,数据自动定期备份随时恢复。点击查看>>
免责声明:本站发布的内容(图片、视频和文字)以原创、转载和分享为主,文章观点不代表本网站立场,如果涉及侵权请联系站长邮箱:is@yisu.com进行举报,并提供相关证据,一经查实,将立刻删除涉嫌侵权内容。


 计算
计算 安全
安全 数据库
数据库 网络和加速
网络和加速 企业服务
企业服务


