这篇文章给大家介绍利用PHP怎么实现一个条形图生成功能,内容非常详细,感兴趣的小伙伴们可以参考借鉴,希望对大家能有所帮助。
具体实现方法如下:
<?php
// create an array of values for the chart. These values
// could come from anywhere, POST, GET, database etc.
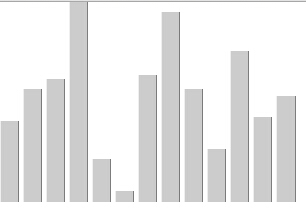
$values = array(23,32,35,57,12,3,36,54,32,15,43,24,30);
// now we get the number of values in the array. this will
// tell us how many columns to plot
$columns = count($values);
// set the height and width of the graph image
$width = 300;
$height = 200;
// Set the amount of space between each column
$padding = 5;
// Get the width of 1 column
$column_width = $width / $columns ;
// set the graph color variables
$im = imagecreate($width,$height);
$gray = imagecolorallocate ($im,0xcc,0xcc,0xcc);
$gray_lite = imagecolorallocate ($im,0xee,0xee,0xee);
$gray_dark = imagecolorallocate ($im,0x7f,0x7f,0x7f);
$white = imagecolorallocate ($im,0xff,0xff,0xff);
// set the background color of the graph
imagefilledrectangle($im,0,0,$width,$height,$white);
// Calculate the maximum value we are going to plot
$max_value = max($values);
// loop over the array of columns
for($i=0;$i<$columns;$i++)
{
// set the column hieght for each value
$column_height = ($height / 100) * (( $values[$i] / $max_value)
*100);
// now the coords
$x1 = $i*$column_width;
$y1 = $height-$column_height;
$x2 = (($i+1)*$column_width)-$padding;
$y2 = $height;
// write the columns over the background
imagefilledrectangle($im,$x1,$y1,$x2,$y2,$gray);
// This gives the columns a little 3d effect
imageline($im,$x1,$y1,$x1,$y2,$gray_lite);
imageline($im,$x1,$y2,$x2,$y2,$gray_lite);
imageline($im,$x2,$y1,$x2,$y2,$gray_dark);
}
// set the correct png headers
header ("Content-type: image/png");
// spit the image out the other end
imagepng($im);
?>运行效果如下图所示:
关于利用PHP怎么实现一个条形图生成功能就分享到这里了,希望以上内容可以对大家有一定的帮助,可以学到更多知识。如果觉得文章不错,可以把它分享出去让更多的人看到。
免责声明:本站发布的内容(图片、视频和文字)以原创、转载和分享为主,文章观点不代表本网站立场,如果涉及侵权请联系站长邮箱:is@yisu.com进行举报,并提供相关证据,一经查实,将立刻删除涉嫌侵权内容。


