本篇内容主要讲解“怎么用Python爬虫预测今年双十一销售额”,感兴趣的朋友不妨来看看。本文介绍的方法操作简单快捷,实用性强。下面就让小编来带大家学习“怎么用Python爬虫预测今年双十一销售额”吧!
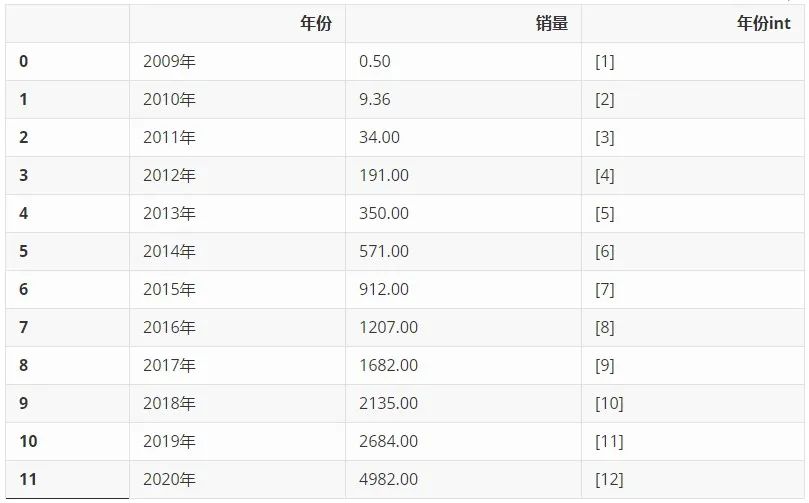
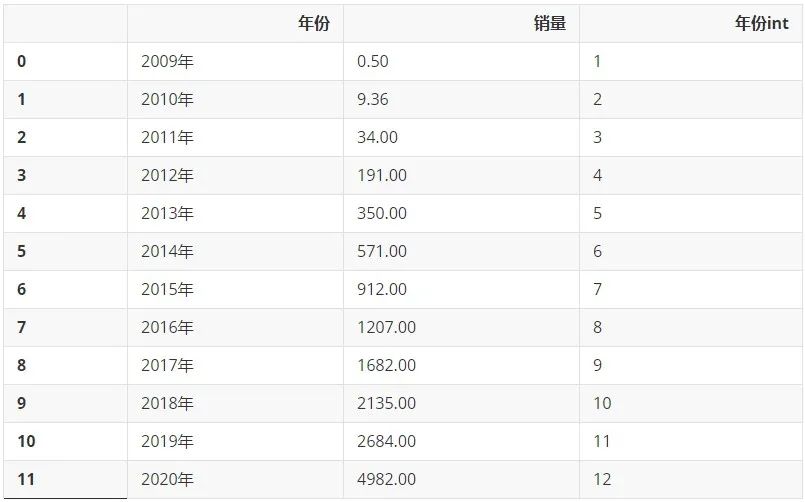
从网上搜集来历年淘宝天猫双十一销售额数据,单位为亿元,利用 Pandas 整理成 Dataframe,又添加了一列'年份int',留作后续的计算使用。
import pandas as pd

# 数据为网络收集,历年淘宝天猫双十一销售额数据,单位为亿元,仅做示范
double11_sales = {'2009年': [0.50],
                  '2010年':[9.36],
                  '2011年':[34],
                  '2012年':[191],
                  '2013年':[350],
                  '2014年':[571],
                  '2015年':[912],
                  '2016年':[1207],
                  '2017年':[1682],
                  '2018年':[2135],
                  '2019年':[2684],
                  '2020年':[4982],
                 }

df = pd.DataFrame(double11_sales).T.reset_index()
df.rename(columns={'index':'年份',0:'销量'},inplace=True)
df['年份int'] = [[i] for i in list(range(1,len(df['年份'])+1))]
df.dataframe tbody tr th {
vertical-align: top;
}
.dataframe thead th {
text-align: right;
}
利用 plotly 工具包,将年份对应销售量的散点图绘制出来,可以明显看到2020年的数据立马飙升。
# 散点图
import plotly as py
import plotly.graph_objs as go
import numpy as np

year = df[:]['年份']
sales = df['销量']

trace = go.Scatter(
    x=year,
    y=sales,
    mode='markers'
)
data = [trace]

layout = go.Layout(title='2009年-2020年天猫淘宝双十一历年销量')

fig = go.Figure(data=data, layout=layout)

fig.show()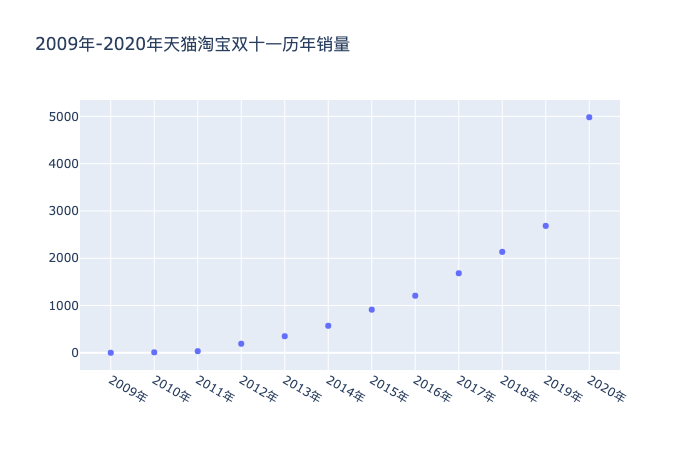
一元多次线性回归
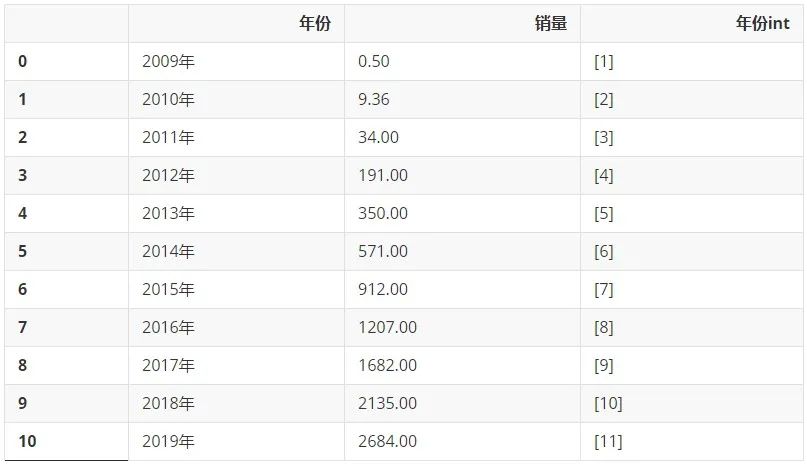
我们先来回顾一下2009-2019年的数据多么美妙。先只选取2009-2019年的数据:
df_2009_2019 = df[:-1]
df_2009_2019.dataframe tbody tr th {
vertical-align: top;
}
.dataframe thead th {
text-align: right;
}
通过以下代码生成二次项数据:
from sklearn.preprocessing import PolynomialFeatures
poly_reg = PolynomialFeatures(degree=2)
X_ = poly_reg.fit_transform(list(df_2009_2019['年份int']))1.第一行代码引入用于增加一个多次项内容的模块 PolynomialFeatures
2.第二行代码设置最高次项为二次项,为生成二次项数据(x平方)做准备
3.第三行代码将原有的X转换为一个新的二维数组X_,该二维数据包含新生成的二次项数据(x平方)和原有的一次项数据(x)
X_ 的内容为下方代码所示的一个二维数组,其中第一列数据为常数项(其实就是X的0次方),没有特殊含义,对分析结果不会产生影响;第二列数据为原有的一次项数据(x);第三列数据为新生成的二次项数据(x的平方)。
X_
array([[  1.,   1.,   1.],
       [  1.,   2.,   4.],
       [  1.,   3.,   9.],
       [  1.,   4.,  16.],
       [  1.,   5.,  25.],
       [  1.,   6.,  36.],
       [  1.,   7.,  49.],
       [  1.,   8.,  64.],
       [  1.,   9.,  81.],
       [  1.,  10., 100.],
[ 1., 11., 121.]])from sklearn.linear_model import LinearRegression
regr = LinearRegression()
regr.fit(X_,list(df_2009_2019['销量']))LinearRegression()1.第一行代码从 Scikit-Learn 库引入线性回归的相关模块 LinearRegression;
2.第二行代码构造一个初始的线性回归模型并命名为 regr;
3.第三行代码用fit() 函数完成模型搭建,此时的regr就是一个搭建好的线性回归模型。
接下来就可以利用搭建好的模型 regr 来预测数据。加上自变量是12,那么使用 predict() 函数就能预测对应的因变量有,代码如下:
XX_ = poly_reg.fit_transform([[12]])XX_
array([[ 1., 12., 144.]])y = regr.predict(XX_) y
array([3282.23478788])这里我们就得到了如果按照这个趋势2009-2019的趋势预测2020的结果,就是3282,但实际却是4982亿,原因就是上文提到的合并计算了,金额一下子变大了,绘制成图,就是下面这样:
# 散点图
import plotly as py
import plotly.graph_objs as go
import numpy as np

year = list(df['年份'])
sales = df['销量']

trace1 = go.Scatter(
    x=year,
    y=sales,
    mode='markers',
    name="实际销量"       # 第一个图例名称
)

XX_ = poly_reg.fit_transform(list(df['年份int'])+[[13]])
regr = LinearRegression()
regr.fit(X_,list(df_2009_2019['销量']))
trace2 = go.Scatter(
    x=list(df['年份']),
    y=regr.predict(XX_),
    mode='lines',
    name="拟合数据",  # 第2个图例名称
)


data = [trace1,trace2]

layout = go.Layout(title='天猫淘宝双十一历年销量',
                    xaxis_title='年份',
                    yaxis_title='销量')

fig = go.Figure(data=data, layout=layout)

fig.show()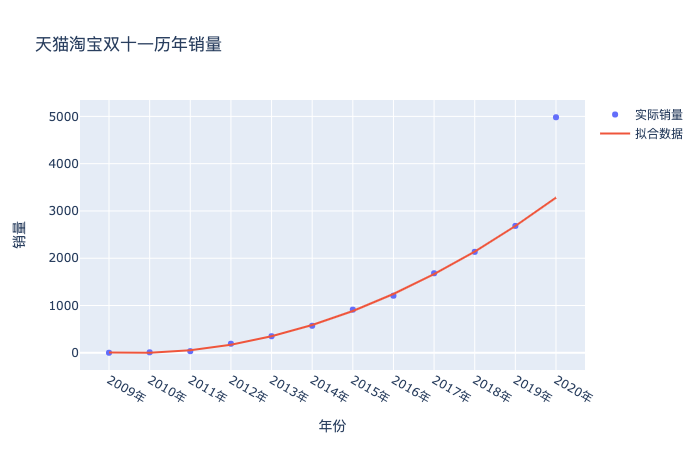
既然数据发生了巨大的偏离,咱们也别深究了,就大力出奇迹。同样的方法,把2020年的真实数据纳入进来,二话不说拟合一样,看看会得到什么结果:
from sklearn.preprocessing import PolynomialFeatures
poly_reg = PolynomialFeatures(degree=5)
X_ = poly_reg.fit_transform(list(df['年份int']))## 预测2020年
regr = LinearRegression()
regr.fit(X_,list(df['销量']))LinearRegression()XXX_ = poly_reg.fit_transform(list(df['年份int'])+[[13]])# 散点图
import plotly as py
import plotly.graph_objs as go
import numpy as np
year = list(df['年份'])
sales = df['销量']
trace1 = go.Scatter(
x=year+['2021年','2022年','2023年'],
y=sales,
mode='markers',
name="实际销量" # 第一个图例名称
)
trace2 = go.Scatter(
x=year+['2021年','2022年','2023年'],
y=regr.predict(XXX_),
mode='lines',
name="预测销量" # 第一个图例名称
)
trace3 = go.Scatter(
x=['2021年'],
y=[regr.predict(XXX_)[-1]],
mode='markers',
name="2021年预测销量" # 第一个图例名称
)
data = [trace1,trace2,trace3]
layout = go.Layout(title='天猫淘宝双十一历年销量',
xaxis_title='年份',
yaxis_title='销量')
fig = go.Figure(data=data, layout=layout)
fig.show()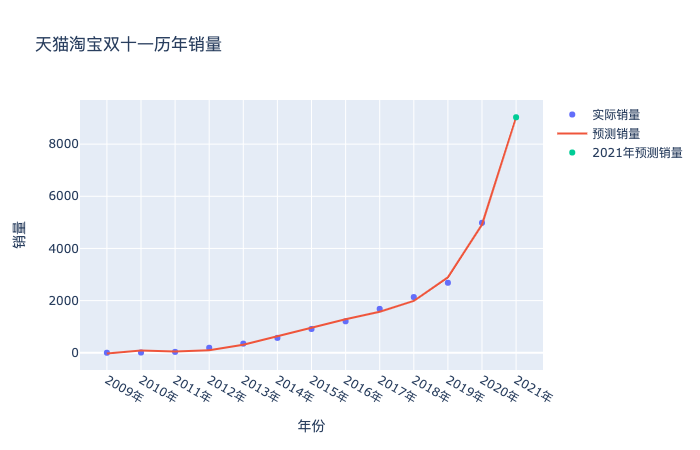
在选择模型中的次数方面,可以通过设置程序,循环计算各个次数下预测误差,然后再根据结果反选参数。
df_new = df.copy()
df_new['年份int'] = df['年份int'].apply(lambda x: x[0])
df_new.dataframe tbody tr th {
vertical-align: top;
}
.dataframe thead th {
text-align: right;
}
#  多项式回归预测次数选择
# 计算 m 次多项式回归预测结果的 MSE 评价指标并绘图
from sklearn.pipeline import make_pipeline
from sklearn.metrics import mean_squared_error

train_df = df_new[:int(len(df)*0.95)]
test_df = df_new[int(len(df)*0.5):]

# 定义训练和测试使用的自变量和因变量
train_x = train_df['年份int'].values
train_y = train_df['销量'].values
# print(train_x)

test_x = test_df['年份int'].values
test_y = test_df['销量'].values

train_x = train_x.reshape(len(train_x),1)
test_x = test_x.reshape(len(test_x),1)
train_y = train_y.reshape(len(train_y),1)

mse = [] # 用于存储各最高次多项式 MSE 值
m = 1 # 初始 m 值
m_max = 10 # 设定最高次数
while m <= m_max:
    model = make_pipeline(PolynomialFeatures(m, include_bias=False), LinearRegression())
    model.fit(train_x, train_y) # 训练模型
    pre_y = model.predict(test_x) # 测试模型
    mse.append(mean_squared_error(test_y, pre_y.flatten())) # 计算 MSE
    m = m + 1

print("MSE 计算结果: ", mse)
# 绘图
plt.plot([i for i in range(1, m_max + 1)], mse, 'r')
plt.scatter([i for i in range(1, m_max + 1)], mse)

# 绘制图名称等
plt.title("MSE of m degree of polynomial regression")
plt.xlabel("m")
plt.ylabel("MSE")MSE 计算结果: [1088092.9621201046, 481951.27857828484, 478840.8575107471, 477235.9140442428, 484657.87153138855, 509758.1526412842, 344204.1969956556, 429874.9229308078, 8281846.231771571, 146298201.8473966]
Text(0, 0.5, 'MSE')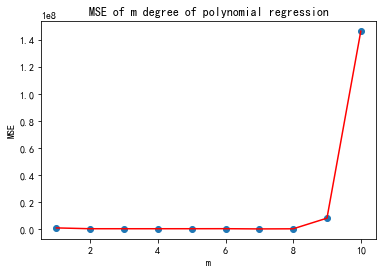
从误差结果可以看到,次数取2到8误差基本稳定,没有明显的减少了,但其实你试试就知道,次数选择3的时候,预测的销量是6213亿元,次数选择5的时候,预测的销量是9029亿元,对于销售量来说,这个范围已经够大的了。我也就斗胆猜到9029亿元,我的胆量也就预测到这里了,破万亿就太夸张了,欢迎胆子大的同学留下你们的预测结果,让我们11月11日,拭目以待吧。
到此,相信大家对“怎么用Python爬虫预测今年双十一销售额”有了更深的了解,不妨来实际操作一番吧!这里是亿速云网站,更多相关内容可以进入相关频道进行查询,关注我们,继续学习!
亿速云「云服务器」,即开即用、新一代英特尔至强铂金CPU、三副本存储NVMe SSD云盘,价格低至29元/月。点击查看>>
免责声明:本站发布的内容(图片、视频和文字)以原创、转载和分享为主,文章观点不代表本网站立场,如果涉及侵权请联系站长邮箱:is@yisu.com进行举报,并提供相关证据,一经查实,将立刻删除涉嫌侵权内容。