这篇文章将为大家详细讲解有关C#如何实现图表中鼠标移动并显示数据,小编觉得挺实用的,因此分享给大家做个参考,希望大家阅读完这篇文章后可以有所收获。
具体内容如下
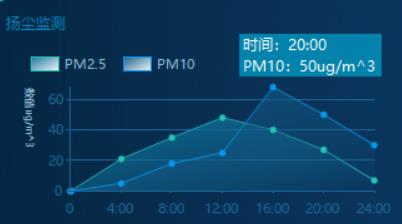
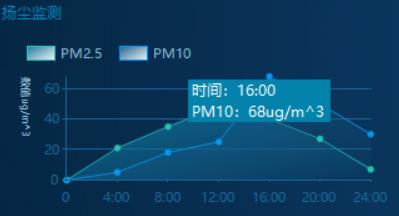
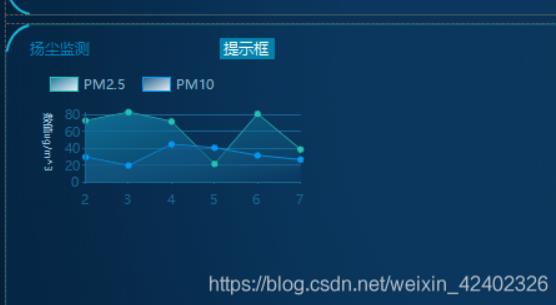
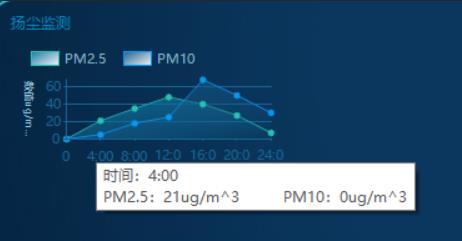
效果图:
1.首先在页面上添加一个label控件并 默认隐藏:
2.给该图表添加MouseMove鼠标移动事件:
/// <summary>
/// 鼠标经过时发生
/// </summary>
/// <param name="sender"></param>
/// <param name="e"></param>
private void chart1_MouseMove(object sender, MouseEventArgs e)
{
   try
   {
       HitTestResult Result = new HitTestResult();
       Result = chart1.HitTest(e.X, e.Y);
       if (Result.Series != null && Result.Object != null)
       {
           // 获取当前焦点x轴的值
           string xValue = ObjectUtil.GetPropertyValue(Result.Object, "AxisLabel").ToString();
           // 获取当前焦点所属区域名称
           string areaName = ObjectUtil.GetPropertyValue(Result.Object, "LegendText").ToString();
           // 获取当前焦点y轴的值
           double yValue = Result.Series.Points[Result.PointIndex].YValues[0];

           // 鼠标经过时label显示
           skinLabel4.Visible = true;
           skinLabel4.Text = "时间:"+ xValue + "\n"+ areaName + ":"+ yValue + "ug/m^3";
           skinLabel4.Location = new Point(e.X, e.Y - 20);
       }
       else
       {
           // 鼠标离开时label隐藏
           skinLabel4.Visible = false;
       }
   }
   catch (Exception se)
   {
       // 鼠标离开时label隐藏
       skinLabel4.Visible = false;
   }

}3.其中GetPropertyValue() 获取对象中的某个属性 方法如下:
public class ObjectUtil
{
   /// <summary>
   /// 获取某个对象中的属性值
   /// </summary>
   /// <param name="info"></param>
   /// <param name="field"></param>
   /// <returns></returns>
   public static object GetPropertyValue(object info, string field)
   {
       if (info == null) return null;
       Type t = info.GetType();
       IEnumerable<System.Reflection.PropertyInfo> property = from pi in t.GetProperties() where pi.Name.ToLower() == field.ToLower() select pi;
       return property.First().GetValue(info, null);
   }
}另外(以下与上述无关)图表添加数据后绑定提示:
/// <summary>
/// 扬尘监测、噪音监测、温度检测、湿度监测
/// </summary>
/// <param name="_Chart"></param>
private void ChartTemperatureMethod(Chart _Chart)
{
    List<string> xData = new List<string>() {"0", "4:00", "8:00", "12:00", "16:00", "20:00", "24:00" };
    List<int> yData = new List<int>() { 0,21, 35, 48, 40, 27, 7 };
    List<int> yData1 = new List<int>() { 0,5, 18, 25, 68, 50, 30 };
    string iss = "#VALX";
    // 需要提示的信息
    chart1.Series["Series1"].ToolTip = "时间:#VALX\nPM2.5:#VALYug/m^3\tPM10:" + yData1[xData.IndexOf("#VALX") + 1] + "ug/m^3";
    // 标签显示 Inside:内部,Outside:外部,Disabled:禁用
    chart1.Series["Series1"]["PieLabelStyle"] = "Outside";
    chart1.Series["Series1"].Points.DataBindXY(xData, yData);

    // 需要提示的信息
    chart1.Series["Series2"].ToolTip = "时间:#VALX\nPM2.5:" + yData[xData.IndexOf("#VALX") + 1] + "ug/m^3\tPM10:#VALYug/m^3";
    // 标签显示 Inside:内部,Outside:外部,Disabled:禁用
    chart1.Series["Series2"]["PieLabelStyle"] = "Outside";
    chart1.Series["Series2"].Points.DataBindXY(xData, yData1);
}关于“C#如何实现图表中鼠标移动并显示数据”这篇文章就分享到这里了,希望以上内容可以对大家有一定的帮助,使各位可以学到更多知识,如果觉得文章不错,请把它分享出去让更多的人看到。
亿速云「云服务器」,即开即用、新一代英特尔至强铂金CPU、三副本存储NVMe SSD云盘,价格低至29元/月。点击查看>>
免责声明:本站发布的内容(图片、视频和文字)以原创、转载和分享为主,文章观点不代表本网站立场,如果涉及侵权请联系站长邮箱:is@yisu.com进行举报,并提供相关证据,一经查实,将立刻删除涉嫌侵权内容。


 计算
计算 安全
安全 数据库
数据库 网络和加速
网络和加速 企业服务
企业服务


