这篇文章主要介绍了C#怎么根据excel数据绘制坐标图的相关知识,内容详细易懂,操作简单快捷,具有一定借鉴价值,相信大家阅读完这篇C#怎么根据excel数据绘制坐标图文章都会有所收获,下面我们一起来看看吧。
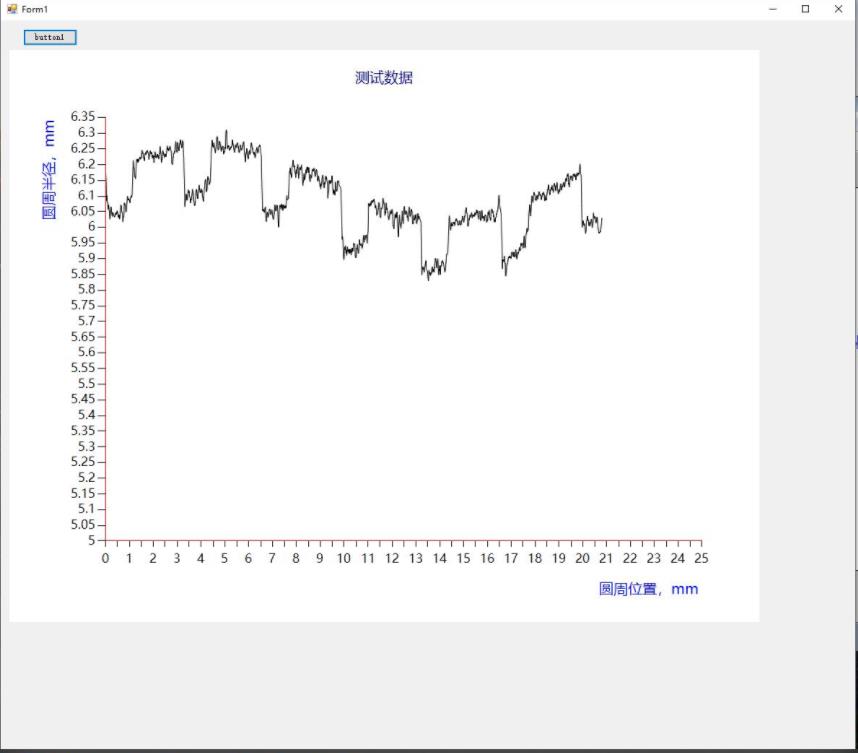
效果如下图
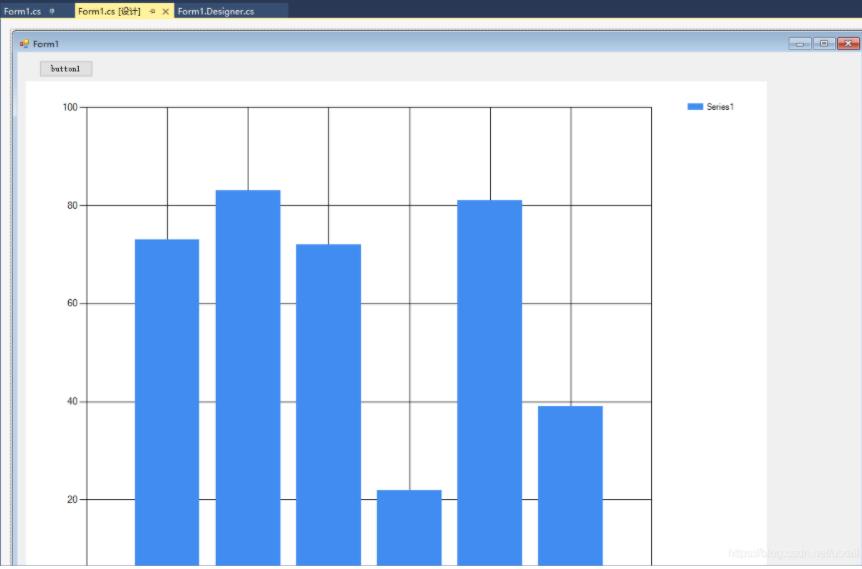
界面
代码
using System;
using System.Collections;
using System.Collections.Generic;
using System.Drawing;
using System.Runtime.InteropServices;
using System.Windows.Forms;
using System.Windows.Forms.DataVisualization.Charting;

namespace WindowsFormsApp2
{
    public partial class Form1 : Form
    {
        //x和y轴数据
        double[] x = new double[] { 0, 0, 0, 0, 0, 0, 0, 0, 0, 0 };
        double[] y = new double[] { 0, 0, 0, 0, 0, 0, 0, 0, 0, 0 };
        List<Double> xList = new List<Double>();
        List<Double> yList = new List<Double>();
        public Form1()
        {
            InitializeComponent();
        }

        private void button1_Click(object sender, EventArgs e)
        {
            string fname = "";
            OpenFileDialog fdlg = new OpenFileDialog();
            fdlg.Title = "Excel File Dialog";
            fdlg.InitialDirectory = @"c:\";
            fdlg.Filter = "All files (*.*)|*.*|All files (*.*)|*.*";
            fdlg.FilterIndex = 2;
            fdlg.RestoreDirectory = true;
            if (fdlg.ShowDialog() == DialogResult.OK)
            {
                fname = fdlg.FileName;
            }


            Microsoft.Office.Interop.Excel.Application xlApp = new Microsoft.Office.Interop.Excel.Application();
            Microsoft.Office.Interop.Excel.Workbook xlWorkbook = xlApp.Workbooks.Open(fname);
            Microsoft.Office.Interop.Excel._Worksheet xlWorksheet = xlWorkbook.Sheets[1];
            Microsoft.Office.Interop.Excel.Range xlRange = xlWorksheet.UsedRange;

            int rowCount = xlRange.Rows.Count;
            int colCount = xlRange.Columns.Count;

            for (int i = 1; i <= rowCount; i++)
            {
                double px = System.Convert.ToDouble(xlRange.Cells[i, 1].Value2.ToString());
                double py = System.Convert.ToDouble(xlRange.Cells[i, 2].Value2.ToString());
                Console.Out.WriteLine("第" + i + "行 :" + px + "," + py);
                xList.Add(px);
                yList.Add(py);
                //for (int j = 1; j <= colCount; j++)
                //{
                //write the value to the Grid
                //if (xlRange.Cells[i, j] != null && xlRange.Cells[i, j].Value2 != null)
                //{
                //xList.Add(xlRange.Cells[i, j]);

                // Console.WriteLine(xlRange.Cells[i, j].Value2.ToString());
                //add useful things here!
                // }
                //}
            }
            chart1.Series[0].Points.DataBindXY(xList, yList);


            //cleanup
            GC.Collect();
            GC.WaitForPendingFinalizers();

            //rule of thumb for releasing com objects:
            //  never use two dots, all COM objects must be referenced and released individually
            //  ex: [somthing].[something].[something] is bad

            //release com objects to fully kill excel process from running in the background
            Marshal.ReleaseComObject(xlRange);
            Marshal.ReleaseComObject(xlWorksheet);

            //close and release
            xlWorkbook.Close();
            Marshal.ReleaseComObject(xlWorkbook);

            //quit and release
            xlApp.Quit();
            Marshal.ReleaseComObject(xlApp);


        }
        //Graphics g = this.CreateGraphics();
        //Pen pen = new Pen(Brushes.Red, 1);
        //g.DrawLine(pen, new Point(30, 50), new Point(250, 250));

        private void Form1_Load(object sender, EventArgs e)
        {
            //控件chart背景色
            //chart1.BackColor = Color.Transparent;//Color.Transparent系统定义的颜色
            //chart1.BackColor = Color.White;
            //图表标题,
            chart1.Titles.Add("测试数据"); //添加title到titleCollection集合的末尾
            chart1.Titles[0].ForeColor = Color.DarkBlue;//设置title的文本颜色
            chart1.Titles[0].Font = new Font("微软雅黑", 15f, FontStyle.Regular);//设置title的字体
            chart1.Titles[0].Alignment = ContentAlignment.TopCenter;//设置title的对齐方式

            //图表区chartAreas
            chart1.ChartAreas[0].BackColor = Color.White;//chartAreas背景颜色
            chart1.ChartAreas[0].BorderColor = Color.Red;//chartAreas边框颜色
            chart1.ChartAreas[0].BackGradientStyle = GradientStyle.None;//chartAreas背景渐变,不使用


            //AxisX表示图表的主x轴;
            chart1.ChartAreas[0].AxisX.LineColor = Color.Red; //线条颜色
            chart1.ChartAreas[0].AxisX.Interval = 0.5;//设置x轴的间隔
            chart1.ChartAreas[0].AxisX.Minimum = 0;
            chart1.ChartAreas[0].AxisX.Maximum = 25;//Y轴坐标固定,不会随绑定的数据而变

            chart1.ChartAreas[0].AxisX.LabelStyle.Interval = 1;//设置X轴标签间距,如果不设置默认为x轴的间隔
            chart1.ChartAreas[0].AxisX.IsLabelAutoFit = false;
            chart1.ChartAreas[0].AxisX.LabelStyle.Font = new Font("微软雅黑", 13f, FontStyle.Regular); //标签字体

            //设置x轴标题的字体样式和颜色
            chart1.ChartAreas[0].AxisX.Title = "圆周位置,mm";
            chart1.ChartAreas[0].AxisX.TitleFont = new Font("微软雅黑", 15f, FontStyle.Regular);// 标题字体
            chart1.ChartAreas[0].AxisX.TitleForeColor = Color.Blue; //轴标题颜色
            chart1.ChartAreas[0].AxisX.TextOrientation = TextOrientation.Horizontal;//轴标题文本方向
            chart1.ChartAreas[0].AxisX.TitleAlignment = StringAlignment.Far;//轴标题对齐方式
            //X轴网格线
            chart1.ChartAreas[0].AxisX.MajorGrid.Enabled = false; //启用网格刻度线,一排竖线
            //chart1.ChartAreas[0].AxisX.MajorGrid.LineColor = ColorTranslator.FromHtml("#2c4c6d"); //线条颜色
            //chart1.ChartAreas[0].AxisX.MajorGrid.LineColor = Color.Yellow;

            //y轴
            chart1.ChartAreas[0].AxisY.LineColor = Color.Red; //线条颜色
            chart1.ChartAreas[0].AxisY.Interval = 0.05;//设置Y轴的间隔
            chart1.ChartAreas[0].AxisY.Minimum = 5;//Y轴坐标固定,不会随绑定的数据而变
            chart1.ChartAreas[0].AxisY.Maximum = 6.35;//Y轴坐标固定,不会随绑定的数据而变
            chart1.ChartAreas[0].AxisY.LabelStyle.Interval = 0.05;//设置X轴标签间距,如果不设置默认为x轴的间隔
            //Y坐标轴标题
            chart1.ChartAreas[0].AxisY.Title = "圆周半径,mm"; //轴标题
            chart1.ChartAreas[0].AxisY.TitleFont = new Font("微软雅黑", 15f, FontStyle.Regular); //标题字体
            chart1.ChartAreas[0].AxisY.TitleForeColor = Color.Blue; //轴标题颜色
            chart1.ChartAreas[0].AxisY.TextOrientation = TextOrientation.Rotated270; //标题文本方向
            chart1.ChartAreas[0].AxisY.TitleAlignment = StringAlignment.Far;
            //y轴标签样式
            chart1.ChartAreas[0].AxisY.LabelStyle.ForeColor = Color.Black; //标签颜色
            chart1.ChartAreas[0].AxisY.LabelStyle.Font = new Font("微软雅黑", 13f, FontStyle.Regular); //标签字体
            //Y轴网格线条
            chart1.ChartAreas[0].AxisY.MajorGrid.Enabled = false;//一排横线
            //chart1.ChartAreas[0].AxisY.MajorGrid.LineColor = Color.Yellow;

            //#VAL为y轴的值,#VALX为x轴数据
            //chart1.Series[0].Label = "hello";//数据点标签文本
            //chart1.Series[0].Label = "#VAL";//数据点标签为其对于的y值
            //chart1.Series[0].LabelBackColor = Color.Blue; //数据点标签背景色
            //chart1.Series[0].LabelForeColor = Color.White; //数据点标签颜色
            //chart1.Series[0].Color = Color.Red; //数据点颜色,数据点之间曲线的颜色
            //chart1.Series[0].BorderWidth = 3;//数据点边框宽度,曲线的宽度
            //chart1.Series[0].ToolTip = "#VALX:#VAL";//鼠标移动到对应点显示数值 元素的工具提示
            chart1.Series[0].ChartType = SeriesChartType.Spline; //图表类型(折线) 绘制该序列的图表类型

            Legend legend = new Legend("波形显示");//初始化具有指定的图例名称
            legend.Title = "legendTitle"; //图例标题文本
            chart1.Series[0].LegendText = legend.Name; //图例中项的文本
            chart1.Legends.Add(legend);
            chart1.Legends[0].Position.Auto = false; //图例矩形位置 - 元素自动定位标志

            //绑定数据
            //数据绑定到指定数据源的第一列的x值和y值的集合的数据点
            chart1.Series[0].Color = Color.Black;

            chart1.Series[0].Points.DataBindXY(x, y);
        }
    }
}
关于“C#怎么根据excel数据绘制坐标图”这篇文章的内容就介绍到这里,感谢各位的阅读!相信大家对“C#怎么根据excel数据绘制坐标图”知识都有一定的了解,大家如果还想学习更多知识,欢迎关注亿速云行业资讯频道。
免责声明:本站发布的内容(图片、视频和文字)以原创、转载和分享为主,文章观点不代表本网站立场,如果涉及侵权请联系站长邮箱:is@yisu.com进行举报,并提供相关证据,一经查实,将立刻删除涉嫌侵权内容。


