今天小编给大家分享一下如何使用python matplotlib绘制散点图的相关知识点,内容详细,逻辑清晰,相信大部分人都还太了解这方面的知识,所以分享这篇文章给大家参考一下,希望大家阅读完这篇文章后有所收获,下面我们一起来了解一下吧。
import matplotlib.pyplot as plt
plt.title("double number", fontsize=24)
plt.xlabel("number", fontsize=14)
plt.ylabel("double", fontsize=14)plt.axis([0, 15, 0, 30])
q前面两个数为x轴的始末,后面则为y
plt.scatter(2, 4, s=20) #s为点的大小
plt.show()
得到这样子的图

毕竟绘图时我们不可能只画一个点
所以还是应该引入数组来解决问题
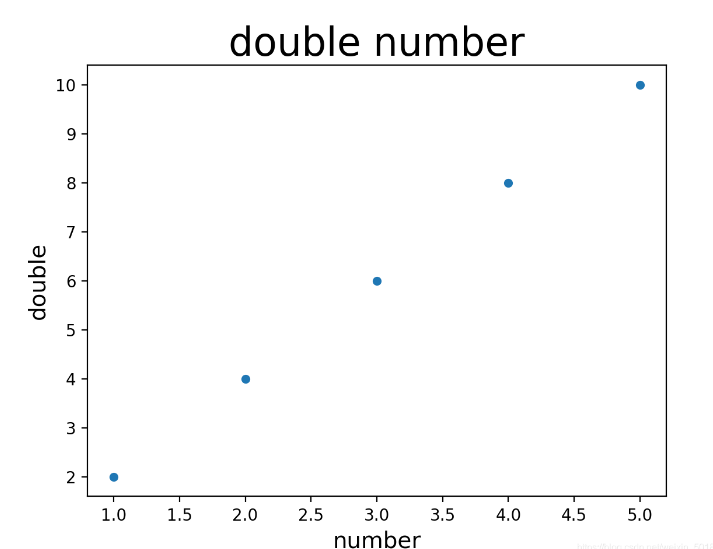
x = [1, 2, 3, 4, 5]
y = [2, 4, 6, 8, 10]
将原来的2,4分别替换为x,y
为了在数据量较大时,简化(偷懒)代码,可以使用range等函数或者列表解析的方法,这里就不赘述了,详见补充1
plt.scatter(x, y, c='red', edgecolors='none', s=20)
用参数c设置点的颜色,用edgecolor设置边缘的颜色(在较新的matpoltlib版本中,edgecolors默认为none)有关颜色的详细资料,可见补充2
ps:将c设置为green,edgecolors设置为black,将引起极度生理不适,特别是点极度密集的曲线中,你懂的
言归正传,python的颜色设置通常为RGB,所以在scatter内也可以用RGB参数来设置颜色,格式如下:
plt.scatter(x, y, c=(0, 0, 0.6), edgecolors='none', s=20)
RGB小数模式详见补充3
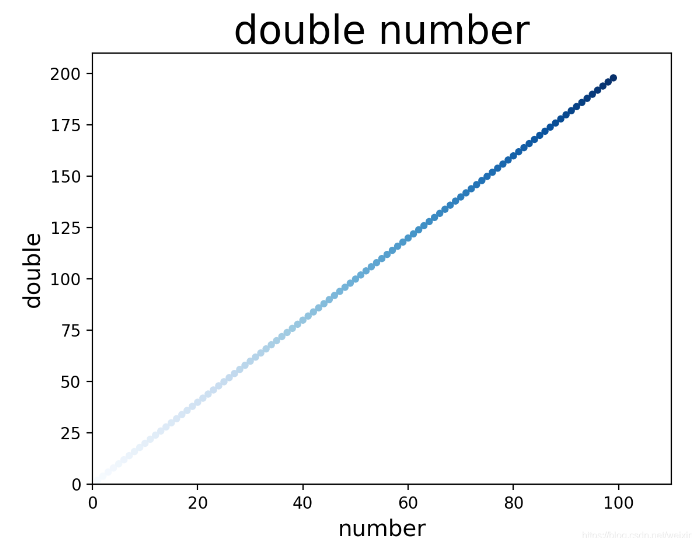
plt.scatter(x, y, c=y, edgecolors='none', cmap=plt.cm.Blues, s=20)
通过使用cmap,将c设置为一个数组,则可以达到颜色渐变的效果:
事实上并非所有的颜色都可以使用,仅有RGB三原色和Oranges等少数颜色可以…感觉官方文档上说的十个好像不太行,格式必须为头文字大写结尾加s
one of {‘tab:blue’, ‘tab:orange’, ‘tab:green’, ‘tab:red’, ‘tab:purple’, ‘tab:brown’, ‘tab:pink’, ‘tab:gray’, ‘tab:olive’, ‘tab:cyan’} which are the Tableau Colors from the ‘tab10’ categorical palette (which is the default color cycle);
That’s all,接下来为补充部分
偷懒法1:用list函数加range函数
x = list(range(1, 100, 2))
先用range(start, end, step)等到一组数,再用list转化为数组
偷懒法2:解析列表
y = [value * 2 for value in x]
其实就是把for循环写到了里面去
Matplotlib识别以下格式以指定颜色:
an RGB or RGBA tuple of float values in [0, 1] (e.g. (0.1, 0.2, 0.5)
or (0.1, 0.2, 0.5, 0.3)). RGBA is short for Red, Green, Blue, Alpha; a
hex RGB or RGBA string (e.g., ‘#0F0F0F’ or ‘#0F0F0F0F’);
速记十六进制RGB或RGBA字符串,相当于通过复制每个字符获得的十六进制RGB或RGBA字符串(例如,’#abc’,相当于’#aabbcc’,或’#abcd’,相当于’#aabbccdd’);
a string representation of a float value in [0, 1] inclusive for gray
level (e.g., ‘0.5’);
单个字母字符串,即{‘b’,‘g’,‘r’,‘c’,‘m’,‘y’,‘k’,‘w’}之一,它们是蓝色、绿色、红色、青色、品红色、黄色、黑色和白色阴影的速记号;
a X11/CSS4 (“html”) color name, e.g. “blue”; a name from the xkcd
color survey, prefixed with ‘xkcd:’ (e.g., ‘xkcd:sky blue’); a “Cn”
color spec, i.e. ‘C’ followed by a number, which is an index into the
default property cycle (rcParams[“axes.prop_cycle”] (default:
cycler(‘color’, [’#1f77b4’, ‘#ff7f0e’, ‘#2ca02c’, ‘#d62728’,
‘#9467bd’, ‘#8c564b’, ‘#e377c2’, ‘#7f7f7f’, ‘#bcbd22’, ‘#17becf’])));
the indexing is intended to occur at rendering time, and defaults to
black if the cycle does not include color. one of {‘tab:blue’,
‘tab:orange’, ‘tab:green’, ‘tab:red’, ‘tab:purple’, ‘tab:brown’,
‘tab:pink’, ‘tab:gray’, ‘tab:olive’, ‘tab:cyan’} which are the Tableau
Colors from the ‘tab10’ categorical palette (which is the default
color cycle);
RGB分为浮点数和整数两种,在Matplotlib中,使用的是浮点数,即范围在[0,1],而整数则是[0,255],若是要转化,将整数除以255即浮点数形式。
以上就是“如何使用python matplotlib绘制散点图”这篇文章的所有内容,感谢各位的阅读!相信大家阅读完这篇文章都有很大的收获,小编每天都会为大家更新不同的知识,如果还想学习更多的知识,请关注亿速云行业资讯频道。
免责声明:本站发布的内容(图片、视频和文字)以原创、转载和分享为主,文章观点不代表本网站立场,如果涉及侵权请联系站长邮箱:is@yisu.com进行举报,并提供相关证据,一经查实,将立刻删除涉嫌侵权内容。


