жӮЁеҘҪпјҢзҷ»еҪ•еҗҺжүҚиғҪдёӢи®ўеҚ•е“ҰпјҒ
жӮЁеҘҪпјҢзҷ»еҪ•еҗҺжүҚиғҪдёӢи®ўеҚ•е“ҰпјҒ
иҝҷзҜҮж–Үз« дё»иҰҒи®Іи§ЈдәҶвҖңжҖҺд№ҲеҲ©з”ЁPythonиҝӣиЎҢе®ўжҲ·еҲҶзҫӨеҲҶжһҗвҖқпјҢж–Үдёӯзҡ„и®Іи§ЈеҶ…е®№з®ҖеҚ•жё…жҷ°пјҢжҳ“дәҺеӯҰд№ дёҺзҗҶи§ЈпјҢдёӢйқўиҜ·еӨ§е®¶и·ҹзқҖе°Ҹзј–зҡ„жҖқи·Ҝж…ўж…ўж·ұе…ҘпјҢдёҖиө·жқҘз ”з©¶е’ҢеӯҰд№ вҖңжҖҺд№ҲеҲ©з”ЁPythonиҝӣиЎҢе®ўжҲ·еҲҶзҫӨеҲҶжһҗвҖқеҗ§пјҒ
import pandas as pd
import matplotlib.pyplot as plt
import seaborn as sns
df = pd.read_csv('sales_2018-01-01_2019-12-31.csv')
df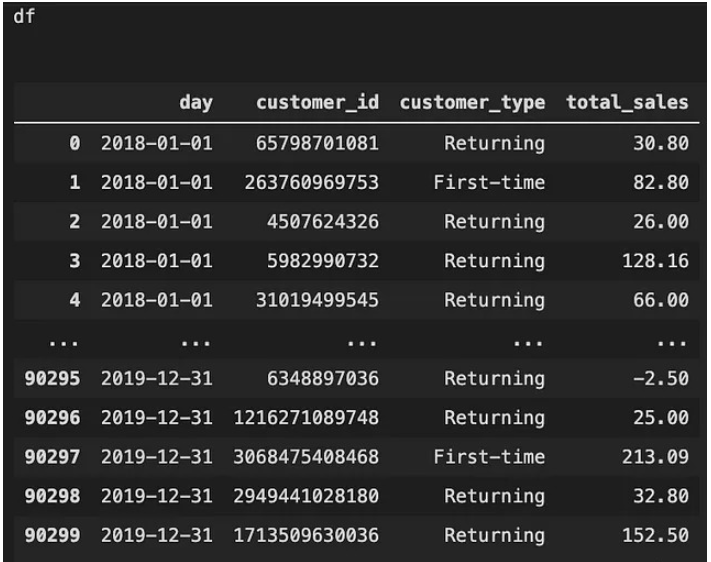
first_time = df.loc[df['customer_type'] == 'First-time',]
final = df.loc[df['customer_id'].isin(first_time['customer_id'].values)]
еңЁиҝҷйҮҢпјҢдёҚиғҪз®ҖеҚ•ең°йҖүжӢ©df.loc[df['customer_type']]пјҢеӣ дёәеңЁиҝҷдёӘж•°жҚ®дёӯпјҢеңЁcustomer_typeеҲ—дёӢпјҢFirst_timeжҢҮзҡ„жҳҜж–°е®ўжҲ·пјҢиҖҢReturningжҢҮзҡ„жҳҜиҖҒе®ўжҲ·гҖӮеӣ жӯӨпјҢеҰӮжһңжҲ‘еңЁ2019е№ҙ12жңҲ31ж—Ҙ第дёҖж¬Ўиҙӯд№°пјҢж•°жҚ®дјҡжҳҫзӨәжҲ‘еңЁ2019е№ҙ12жңҲ31ж—ҘжҳҜж–°е®ўжҲ·пјҢдҪҶеңЁжҲ‘第дәҢж¬ЎгҖҒ第дёүж¬Ў…ж—¶жҳҜиҝ”еӣһе®ўжҲ·гҖӮеҗҢжңҹзҫӨеҲҶжһҗзқҖзңјдәҺж–°е®ўжҲ·е’Ң他们зҡ„еҗҺз»ӯиҙӯд№°иЎҢдёәгҖӮеӣ жӯӨпјҢеҰӮжһңжҲ‘们з®ҖеҚ•ең°дҪҝз”Ёdf.loc[df['customer_type']=='First-time',]пјҢжҲ‘们е°ұдјҡеҝҪз•Ҙж–°е®ўжҲ·зҡ„еҗҺз»ӯиҙӯд№°пјҢиҝҷдёҚжҳҜеҲҶжһҗеҗҢжңҹзҫӨиЎҢдёәзҡ„жӯЈзЎ®ж–№жі•гҖӮ
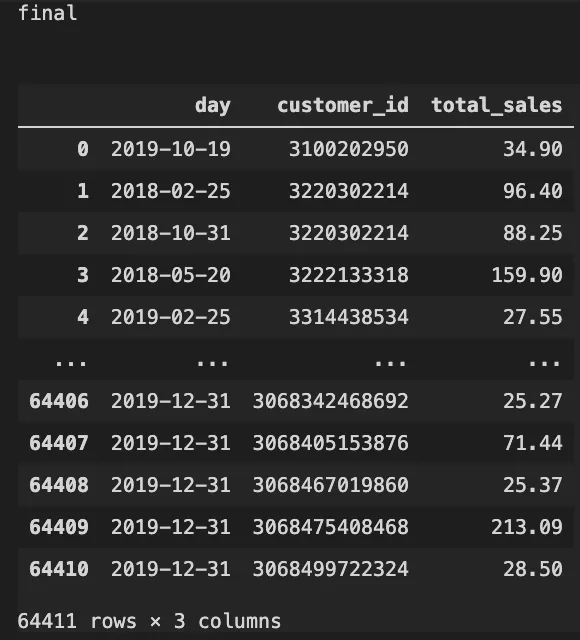
еӣ жӯӨпјҢиҝҷйҮҢжүҖйңҖиҰҒеҒҡзҡ„жҳҜпјҢйҰ–е…ҲеҲӣе»әдёҖдёӘжүҖжңү第дёҖж¬Ўзҡ„е®ўжҲ·еҲ—иЎЁпјҢ并е°Ҷе…¶еӯҳеӮЁдёәfirst_timeгҖӮ然еҗҺд»ҺеҺҹе§Ӣе®ўжҲ·ж•°жҚ®жЎҶdfдёӯеҸӘйҖүжӢ©йӮЈдәӣIDеңЁfirst_timeе®ўжҲ·з»„еҶ…зҡ„е®ўжҲ·гҖӮйҖҡиҝҮиҝҷж ·еҒҡпјҢжҲ‘们еҸҜд»ҘзЎ®дҝқжҲ‘们иҺ·еҫ—зҡ„ж•°жҚ®еҸӘжңү第дёҖж¬Ўзҡ„е®ўжҲ·е’Ң他们еҗҺжқҘзҡ„иҙӯд№°иЎҢдёәгҖӮ
зҺ°еңЁпјҢжҲ‘们еҲ йҷӨcustomer_typeеҲ—пјҢеӣ дёәе®ғе·Із»ҸжІЎжңүеҝ…иҰҒдәҶгҖӮеҗҢж—¶пјҢе°Ҷж—ҘжңҹеҲ—иҪ¬жҚўжҲҗжӯЈзЎ®зҡ„ж—Ҙжңҹж—¶й—ҙж јејҸ
final = final.drop(columns = ['customer_type'])
final['day']= pd.to_datetime(final['day'], dayfirst=True)
final = final.drop(columns = ['customer_type'])
final['day']= pd.to_datetime(final['day'], dayfirst=True)
def purchase_rate(customer_id):
    purchase_rate = [1]
    counter = 1
    for i in range(1,len(customer_id)):
          if customer_id[i] != customer_id[i-1]:
                 purchase_rate.append(1)
                 counter = 1
          else:
                 counter += 1
                 purchase_rate.append(counter)
    return purchase_rate
def join_date(date, purchase_rate):
    join_date = list(range(len(date)))
    for i in range(len(purchase_rate)):
          if purchase_rate[i] == 1:
                 join_date[i] = date[i]
          else:
                 join_date[i] = join_date[i-1]
    return join_date
def age_by_month(purchase_rate, month, year, join_month, join_year):
    age_by_month = list(range(len(year)))
    for i in range(len(purchase_rate)):
          if purchase_rate[i] == 1:
              age_by_month[i] = 0
          else:
              if year[i] == join_year[i]:
                 age_by_month[i] = month[i] - join_month[i]
              else:
                 age_by_month[i] = month[i] - join_month[i] + 12*(year[i]-join_year[i])
     return age_by_month
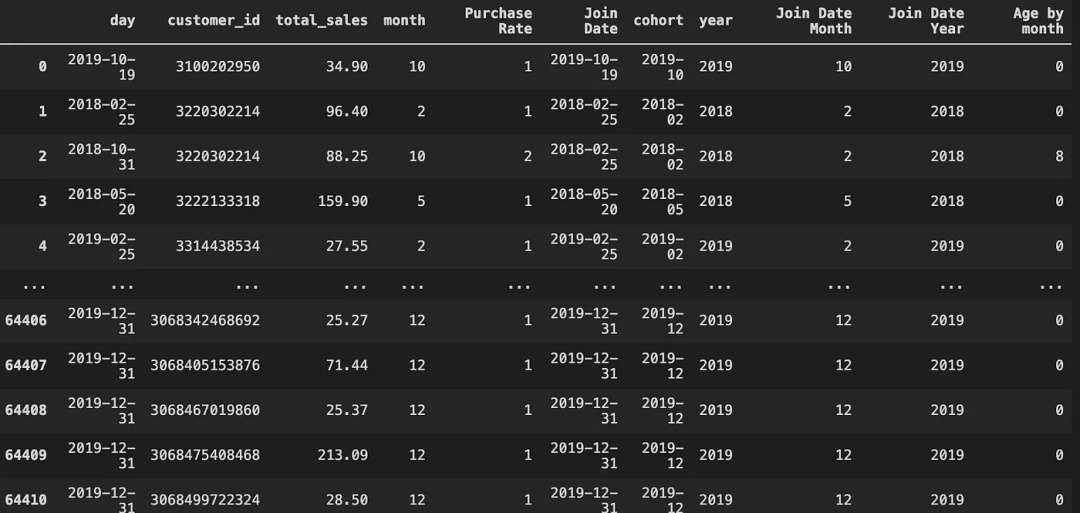
purchase_rateеҮҪж•°е°ҶеҶіе®ҡиҝҷжҳҜеҗҰжҳҜжҜҸдёӘе®ўжҲ·зҡ„第дәҢж¬ЎгҖҒ第дёүж¬ЎгҖҒ第еӣӣж¬Ўиҙӯд№°гҖӮ
join_dateеҮҪж•°е…Ғи®ёзЎ®е®ҡе®ўжҲ·еҠ е…Ҙзҡ„ж—ҘжңҹгҖӮ
age_by_monthеҮҪж•°жҸҗдҫӣдәҶд»Һе®ўжҲ·еҪ“еүҚиҙӯд№°еҲ°з¬¬дёҖж¬Ўиҙӯд№°зҡ„еӨҡе°‘дёӘжңҲгҖӮ
зҺ°еңЁиҫ“е…Ҙе·Із»ҸеҮҶеӨҮеҘҪдәҶпјҢжҺҘдёӢжқҘеҲӣе»әзҫӨз»„гҖӮ
final['month'] =pd.to_datetime(final['day']).dt.month
final['Purchase Rate'] = purchase_rate(final['customer_id'])
final['Join Date'] = join_date(final['day'], final['Purchase Rate'])
final['Join Date'] = pd.to_datetime(final['Join Date'], dayfirst=True)
final['cohort'] = pd.to_datetime(final['Join Date']).dt.strftime('%Y-%m')
final['year'] = pd.to_datetime(final['day']).dt.year
final['Join Date Month'] = pd.to_datetime(final['Join Date']).dt.month
final['Join Date Year'] = pd.to_datetime(final['Join Date']).dt.year
final['Age by month'] = age_by_month(final['Purchase Rate'],
                                     final['month'],
                                     final['year'],
                                     final['Join Date Month'],
                                     final['Join Date Year'])
cohorts = final.groupby(['cohort','Age by month']).nunique()
cohorts = cohorts.customer_id.to_frame().reset_index()   # convert series to frame
cohorts = pd.pivot_table(cohorts, values = 'customer_id',index = 'cohort', columns= 'Age by month')
cohorts.replace(np.nan, '',regex=True)

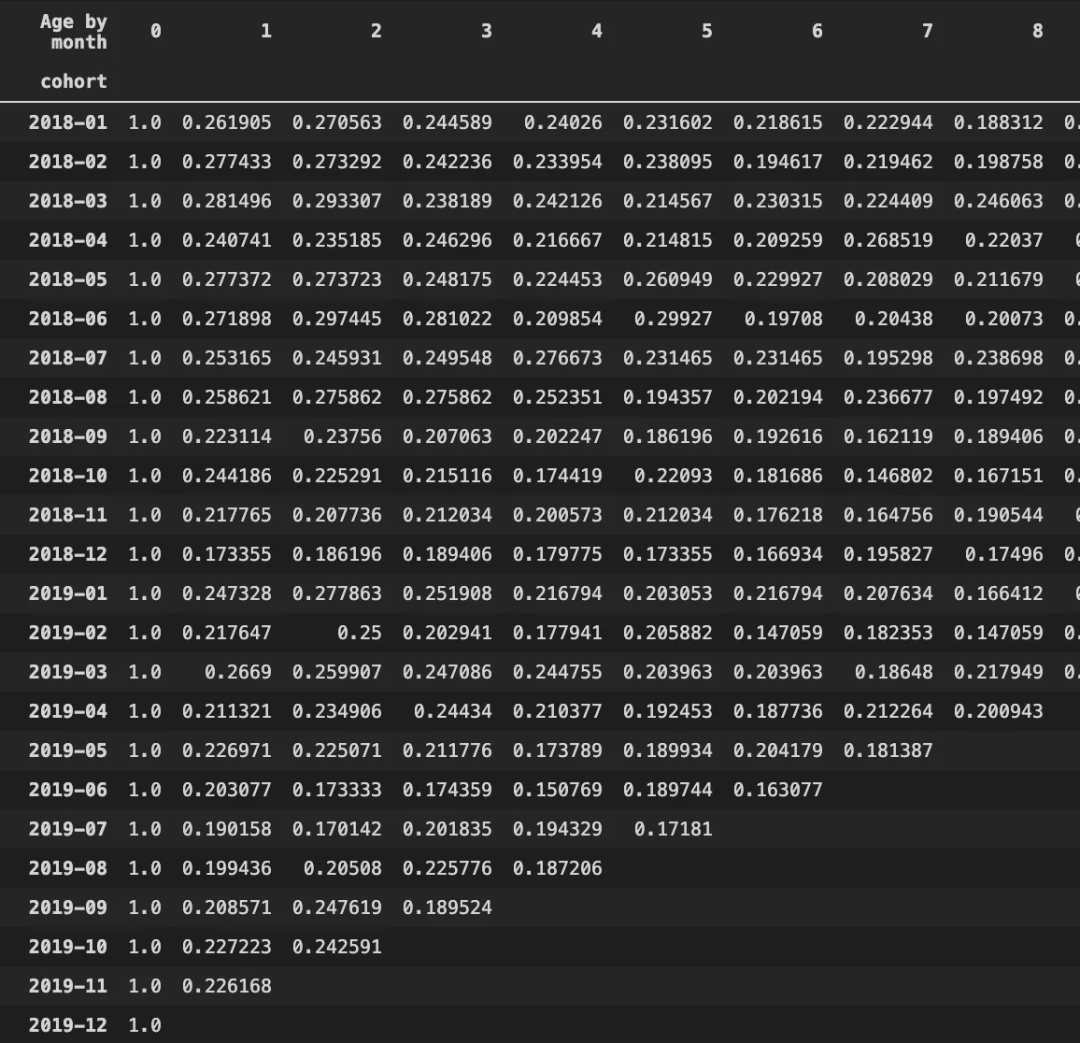
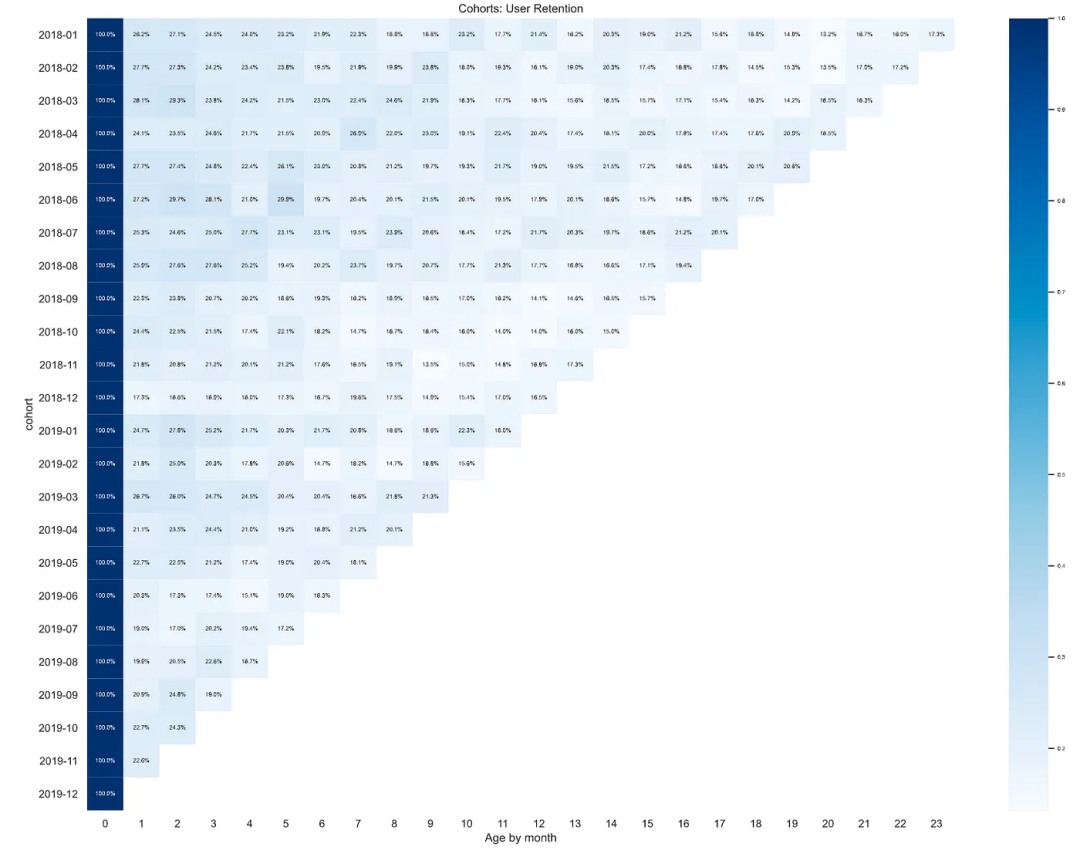
**еҰӮдҪ•и§ЈйҮҠиҝҷдёӘиЎЁж јпјҡ**д»ҘзҫӨз»„2018-01дёәдҫӢгҖӮеңЁ2018е№ҙ1жңҲпјҢжңү462еҗҚж–°е®ўжҲ·гҖӮеңЁиҝҷ462дәәдёӯпјҢ121еҗҚе®ўжҲ·еңЁ2018е№ҙ2жңҲеӣһжқҘиҙӯд№°пјҢ125еҗҚеңЁ2018е№ҙ3жңҲиҙӯд№°пјҢд»ҘжӯӨзұ»жҺЁгҖӮ
for i in range(len(cohorts)-1):
    cohorts[i+1] = cohorts[i+1]/cohorts[0]
cohorts[0] = cohorts[0]/cohorts[0]
cohorts_t = cohorts.transpose()
cohorts_t[cohorts_t.columns].plot(figsize=(10,5))
sns.set(style='whitegrid')
plt.figure(figsize=(20, 15))
plt.title('Cohorts: User Retention')
sns.set(font_scale = 0.5) # font size
sns.heatmap(cohorts, mask=cohorts.isnull(),
cmap="Blues",
annot=True, fmt='.01%')
plt.show()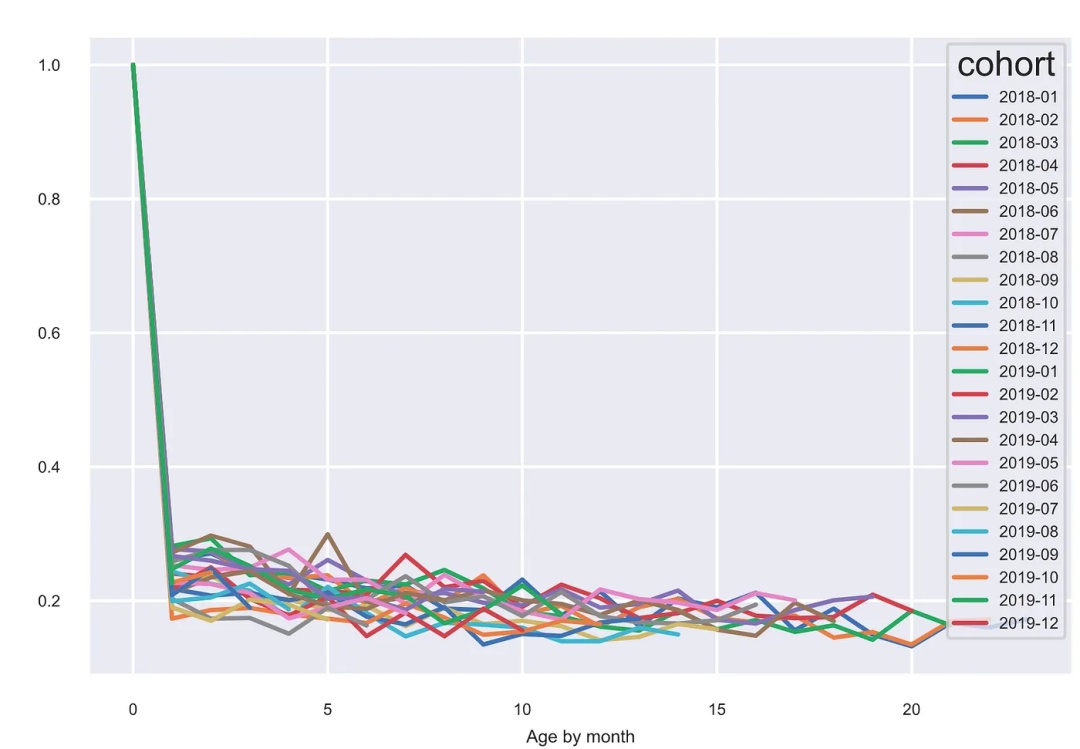
ж„ҹи°ўеҗ„дҪҚзҡ„йҳ…иҜ»пјҢд»ҘдёҠе°ұжҳҜвҖңжҖҺд№ҲеҲ©з”ЁPythonиҝӣиЎҢе®ўжҲ·еҲҶзҫӨеҲҶжһҗвҖқзҡ„еҶ…е®№дәҶпјҢз»ҸиҝҮжң¬ж–Үзҡ„еӯҰд№ еҗҺпјҢзӣёдҝЎеӨ§е®¶еҜ№жҖҺд№ҲеҲ©з”ЁPythonиҝӣиЎҢе®ўжҲ·еҲҶзҫӨеҲҶжһҗиҝҷдёҖй—®йўҳжңүдәҶжӣҙж·ұеҲ»зҡ„дҪ“дјҡпјҢе…·дҪ“дҪҝз”Ёжғ…еҶөиҝҳйңҖиҰҒеӨ§е®¶е®һи·өйӘҢиҜҒгҖӮиҝҷйҮҢжҳҜдәҝйҖҹдә‘пјҢе°Ҹзј–е°ҶдёәеӨ§е®¶жҺЁйҖҒжӣҙеӨҡзӣёе…ізҹҘиҜҶзӮ№зҡ„ж–Үз« пјҢж¬ўиҝҺе…іжіЁпјҒ
е…ҚиҙЈеЈ°жҳҺпјҡжң¬з«ҷеҸ‘еёғзҡ„еҶ…е®№пјҲеӣҫзүҮгҖҒи§Ҷйў‘е’Ңж–Үеӯ—пјүд»ҘеҺҹеҲӣгҖҒиҪ¬иҪҪе’ҢеҲҶдә«дёәдё»пјҢж–Үз« и§ӮзӮ№дёҚд»ЈиЎЁжң¬зҪ‘з«ҷз«ӢеңәпјҢеҰӮжһңж¶үеҸҠдҫөжқғиҜ·иҒ”зі»з«ҷй•ҝйӮ®з®ұпјҡis@yisu.comиҝӣиЎҢдёҫжҠҘпјҢ并жҸҗдҫӣзӣёе…іиҜҒжҚ®пјҢдёҖз»ҸжҹҘе®һпјҢе°Ҷз«ӢеҲ»еҲ йҷӨж¶үе«ҢдҫөжқғеҶ…е®№гҖӮ