预计该博文篇幅较长,这里不再废话,对ganglia不太了解的去问谷老师,直接看环境:
hadoop1.updb.com 192.168.0.101
hadoop2.updb.com 192.168.0.102
hadoop3.updb.com 192.168.0.103
hadoop4.updb.com 192.168.0.104
hadoop5.updb.com 192.168.0.105
操作系统:centos 6.5 x86_64,使用自带网络yum源,同时配置epel扩展源。
在安装ganglia之前,确保你的hadoop及hbase已经安装成功,看我的安装规划:
hadoop1.updb.com NameNode|HMaster|gmetad|gmond|ganglia-web|nagios
hadoop2.updb.com DataNode|Regionserver|gmond|nrpe
hadoop3.updb.com DataNode|Regionserver|gmond|nrpe
hadoop4.updb.com DataNode|Regionserver|gmond|nrpe
hadoop5.updb.com DataNode|Regionserver|gmond|nrpe
hadoop1作为ganglia和nagios的主控端,安装的软件为ganglia的服务端gmetad、由于要监控自身节点,所以还需要安装ganglia的客户端gmond以及ganglia的web应用ganglia-web和nagios服务端;hadoop2、hadoop3、hadoop4、hadoop5作为被控端,安装的软件有ganglia的客户端gmond以及nagios的客户端nrpe。注意这里的nrpe不是一定要安装的,这里是因为我要监控hadoop2、hadoop3、hadoop4、hadoop5节点上的mysql及其他一些服务,所以选择安装nrpe。
1、hadoop1安装ganglia的gmetad、gmond及ganglia-web
首先安装ganglia所需要的依赖包
[root@hadoop1 ~]# cat ganglia.rpm
apr-devel
apr-util
check-devel
cairo-devel
pango-devel
libxml2-devel
glib2-devel
dbus-devel
freetype-devel
fontconfig-devel
gcc-c++
expat-devel
python-devel
libXrender-devel
zlib
libart_lgpl
libpng
dejavu-lgc-sans-mono-fonts
dejavu-sans-mono-fonts
perl-ExtUtils-CBuilder
perl-ExtUtils-MakeMaker

[root@hadoop1 ~]# yum install -y `cat ganglia.rpm`除了上面的依赖,还需要安装confuse-2.7.tar.gz、rrdtool-1.4.8.tar.gz两个软件
## 解压软件
[root@hadoop1 pub]# tar xf rrdtool-1.4.8.tar.gz  -C /opt/soft/
[root@hadoop1 pub]# tar xf confuse-2.7.tar.gz  -C /opt/soft/
## 安装rrdtool
[root@hadoop1 rrdtool-1.4.8]# ./configure  -prefix=/usr/local/rrdtool
[root@hadoop1 rrdtool-1.4.8]# make && make install
[root@hadoop1 rrdtool-1.4.8]# mkdir  /usr/local/rrdtool/lib64
[root@hadoop1 rrdtool-1.4.8]# cp /usr/local/rrdtool/lib/* /usr/local/rrdtool/lib64/ -rf
[root@hadoop1 rrdtool-1.4.8]# cp /usr/local/rrdtool/lib/librrd.so /usr/lib/
[root@hadoop1 rrdtool-1.4.8]# cp /usr/local/rrdtool/lib/librrd.so /usr/lib64/
## 安装confuse
[root@hadoop1 rrdtool-1.4.8]# cd ../confuse-2.7/
[root@hadoop1 confuse-2.7]# ./configure CFLAGS=-fPIC --disable-nls --prefix=/usr/local/confuse
[root@hadoop1 confuse-2.7]# make && make install
[root@hadoop1 confuse-2.7]# mkdir  /usr/local/confuse/lib64
[root@hadoop1 confuse-2.7]# cp /usr/local/confuse/lib/* /usr/local/confuse/lib64/ -rfok,准备工作做好之后,开始安装ganglia软件中的gmetad和gmond
## 解压软件
[root@hadoop1 pub]# tar xf ganglia-3.6.0.tar.gz  -C /opt/soft/
[root@hadoop1 pub]# cd  /opt/soft/ganglia-3.6.0/
## 安装gmetad
[root@hadoop1 ganglia-3.6.0]# ./configure --prefix=/usr/local/ganglia  --with-librrd=/usr/local/rrdtool
--with-libconfuse=/usr/local/confuse --with-gmetad --with-libpcre=no --enable-gexec --enable-status
--sysconfdir=/etc/ganglia
[root@hadoop1 ganglia-3.6.0]# make && make install
[root@hadoop1 ganglia-3.6.0]# cp gmetad/gmetad.init /etc/init.d/gmetad
[root@hadoop1 ganglia-3.6.0]# cp /usr/local/ganglia/sbin/gmetad /usr/sbin/
[root@hadoop1 ganglia-3.6.0]# chkconfig --add gmetad
## 安装gmond
[root@hadoop1 ganglia-3.6.0]# cp gmond/gmond.init /etc/init.d/gmond
[root@hadoop1 ganglia-3.6.0]# cp /usr//local/ganglia/sbin/gmond /usr/sbin/
[root@hadoop1 ganglia-3.6.0]# gmond --default_config>/etc/ganglia/gmond.conf
[root@hadoop1 ganglia-3.6.0]# chkconfig --add gmond至此,hadoop1上的gmetad、gmond安装成功,接着安装ganglia-web,首先要安装php和httpd
yum install php httpd -y
修改httpd的配置文件/etc/httpd/conf/httpd.conf,只把监听端口改为8080
Listen 8080安装ganglia-web
[root@hadoop1 pub]# tar xf ganglia-web-3.6.2.tar.gz  -C /opt/soft/
[root@hadoop1 pub]# cd  /opt/soft/
[root@hadoop1 soft]# mv ganglia-web-3.6.2/ /var/www/html/ganglia
[root@hadoop1 soft]# chmod 777 /var/www/html/ganglia -R
[root@hadoop1 soft]# cd /var/www/html/ganglia
[root@hadoop1 ganglia]# useradd www-data
[root@hadoop1 ganglia]# make install
[root@hadoop1 ganglia]# chmod 777 /var/lib/ganglia-web/dwoo/cache/
[root@hadoop1 ganglia]# chmod 777 /var/lib/ganglia-web/dwoo/compiled/至此ganglia-web安装完成,修改conf_default.php修改文件,指定ganglia-web的目录及rrds的数据目录,修改如下两行:
     36 # Where gmetad stores the rrd archives.
     37 $conf['gmetad_root'] = "/var/www/html/ganglia"; ## 改为web程序的安装目录
38 $conf['rrds'] = "/var/lib/ganglia/rrds"; ## 指定rrd数据存放的路径创建rrd数据存放目录并授权
[root@hadoop1 ganglia]# mkdir /var/lib/ganglia/rrds -p
[root@hadoop1 ganglia]# chown nobody:nobody /var/lib/ganglia/rrds/ -R到这里,hadoop1上的ganglia的所有安装工作就完成了,接下来就是要在hadoop2、hadoop3、hadoop4、hadoop5上安装ganglia的gmond客户端。
2、在hadoop2、hadoop3、hadoop4、hadoop5上安装gmond
首先还是需要安装依赖,参照hadoop1中的前两步来安装所需依赖
ok,准备工作做好之后,开始安装gmond,4个节点的操作是一样的,这里以hadoop2为例
## 解压软件
[root@hadoop2 pub]# tar xf ganglia-3.6.0.tar.gz  -C /opt/soft/
[root@hadoop2 pub]# cd  /opt/soft/ganglia-3.6.0/
## 安装gmond,注意这里的编译和gmetad相比少了--with-gmetad
[root@hadoop2 ganglia-3.6.0]# ./configure --prefix=/usr/local/ganglia  --with-librrd=/usr/local/rrdtool
--with-libconfuse=/usr/local/confuse --with-libpcre=no --enable-gexec --enable-status
--sysconfdir=/etc/ganglia
[root@hadoop2 ganglia-3.6.0]# make && make install
[root@hadoop2 ganglia-3.6.0]# cp gmond/gmond.init /etc/init.d/gmond
[root@hadoop2 ganglia-3.6.0]# cp /usr//local/ganglia/sbin/gmond /usr/sbin/
[root@hadoop2 ganglia-3.6.0]# gmond --default_config>/etc/ganglia/gmond.conf
[root@hadoop2 ganglia-3.6.0]# chkconfig --add gmond到这里hadoop2上的gmond已经安装成功,hadoop3、hadoop4、hadoop5依次安装成功。
3、配置ganglia,分为服务端和客户端的配置,服务端的配置文件为gmetad.conf,客户端的配置文件为gmond.conf
首先配置hadoop1上的gmetad.conf
[root@hadoop1 ~]# vi  /etc/ganglia/gmetad.conf
## 定义数据源的名字及监听地址,gmond会将收集的数据发送到数据源监听机器上的rrd数据目录中
data_source "hadoop cluster" 192.168.0.101:8649gmetad.conf的配置相当的简单,注意gmetad.conf只有hadoop1上有,因此只在hadoop1上配置。接着配置hadoop1上的gmond.conf
[root@hadoop1 ~]# head -n 80  /etc/ganglia/gmond.conf
/* This configuration is as close to 2.5.x default behavior as possible
   The values closely match ./gmond/metric.h definitions in 2.5.x */
globals {
  daemonize = yes        ## 以守护进程运行
  setuid = yes
  user = nobody          ## 运行gmond的用户
  debug_level = 0        ## 改为1会在启动时打印debug信息
  max_udp_msg_len = 1472
  mute = no              ## 哑巴,本节点将不会再广播任何自己收集到的数据到网络上
  deaf = no              ## 聋子,本节点将不再接收任何其他节点广播的数据包
  allow_extra_data = yes
  host_dmax = 86400 /*secs. Expires (removes from web interface) hosts in 1 day */
  host_tmax = 20 /*secs */
  cleanup_threshold = 300 /*secs */
  gexec = no
  # By default gmond will use reverse DNS resolution when displaying your hostname
  # Uncommeting following value will override that value.
  # override_hostname = "mywebserver.domain.com"
  # If you are not using multicast this value should be set to something other than 0.
  # Otherwise if you restart aggregator gmond you will get empty graphs. 60 seconds is reasonable
  send_metadata_interval = 0 /*secs */

}

/*
 * The cluster attributes specified will be used as part of the <CLUSTER>
 * tag that will wrap all hosts collected by this instance.
 */
cluster {
  name = "hadoop cluster"    ## 指定集群的名字
  owner = "nobody"           ## 集群的所有者
  latlong = "unspecified"
  url = "unspecified"
}

/* The host section describes attributes of the host, like the location */
host {
  location = "unspecified"
}

/* Feel free to specify as many udp_send_channels as you like.  Gmond
   used to only support having a single channel */
udp_send_channel {
  #bind_hostname = yes # Highly recommended, soon to be default.
                       # This option tells gmond to use a source address
                       # that resolves to the machine's hostname.  Without
                       # this, the metrics may appear to come from any
                       # interface and the DNS names associated with
                       # those IPs will be used to create the RRDs.
#  mcast_join = 239.2.11.71    ## 单播模式要注释调这行
  host = 192.168.0.101    ## 单播模式,指定接受数据的主机
  port = 8649             ## 监听端口
  ttl = 1
}

/* You can specify as many udp_recv_channels as you like as well. */
udp_recv_channel {
  #mcast_join = 239.2.11.71    ## 单播模式要注释调这行
  port = 8649
  #bind = 239.2.11.71          ## 单播模式要注释调这行
  retry_bind = true
  # Size of the UDP buffer. If you are handling lots of metrics you really
  # should bump it up to e.g. 10MB or even higher.
  # buffer = 10485760
}

/* You can specify as many tcp_accept_channels as you like to share
   an xml description of the state of the cluster */
tcp_accept_channel {
  port = 8649
  # If you want to gzip XML output
  gzip_output = no
}

/* Channel to receive sFlow datagrams */
#udp_recv_channel {
#  port = 6343
#}

/* Optional sFlow settings */好了,hadoop1上的gmetad.conf和gmond.conf配置文件已经修改完成,这时,直接将hadoop1上的gmond.conf文件scp到hadoop2、hadoop3、hadoop4、hadoop5上相同的路径下覆盖原来的gmond.conf即可。
4、启动服务
启动hadoop1、hadoop2、hadoop3、hadoop4、hadoop5上的gmond服务
/etc/init.d/gmond start启动hadoop1上的httpd服务和gmetad服务
/etc/init.d/gmetad start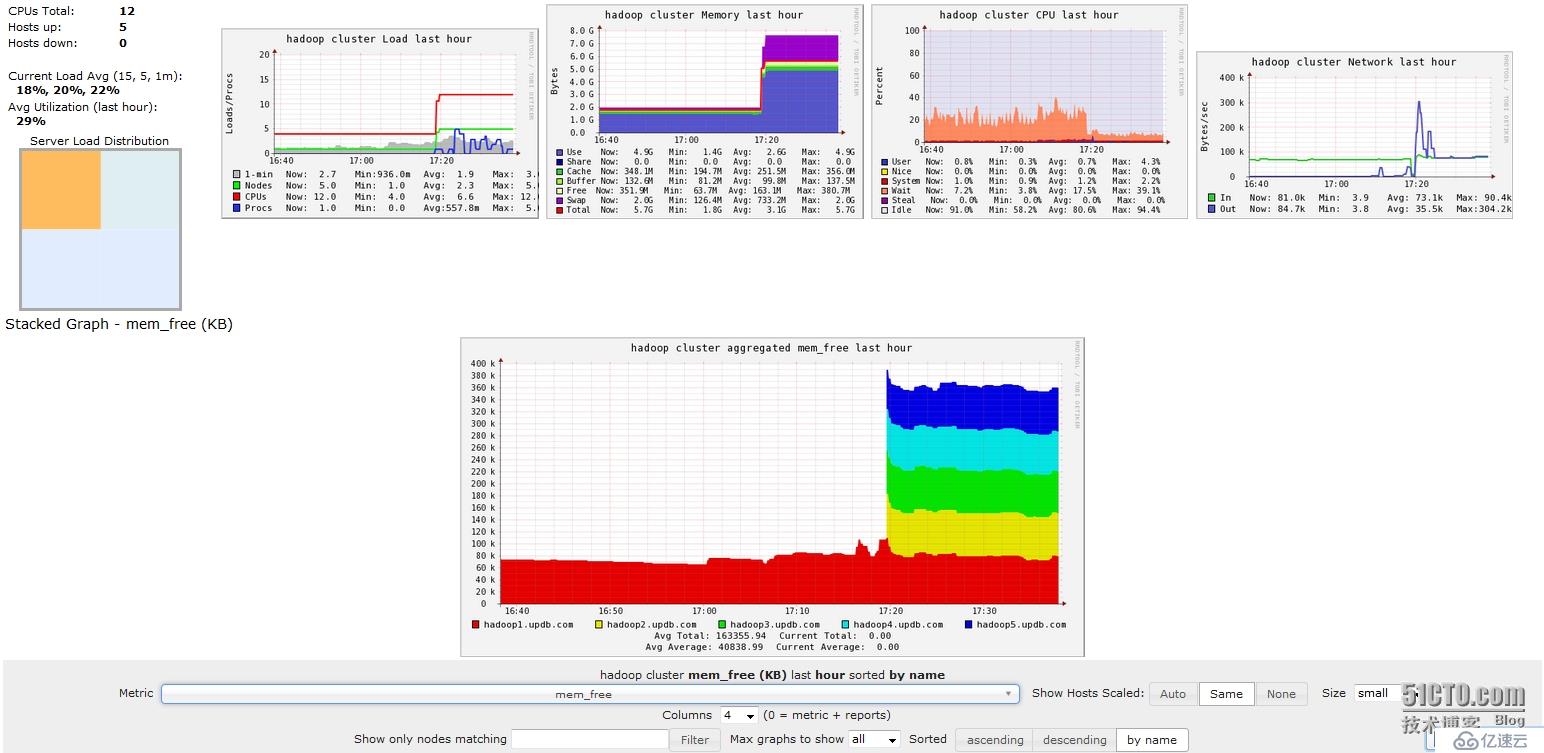
/etc/init.d/httpd start5、在浏览器中访问192.168.0.101:8080/ganglia,就会出现下面的页面
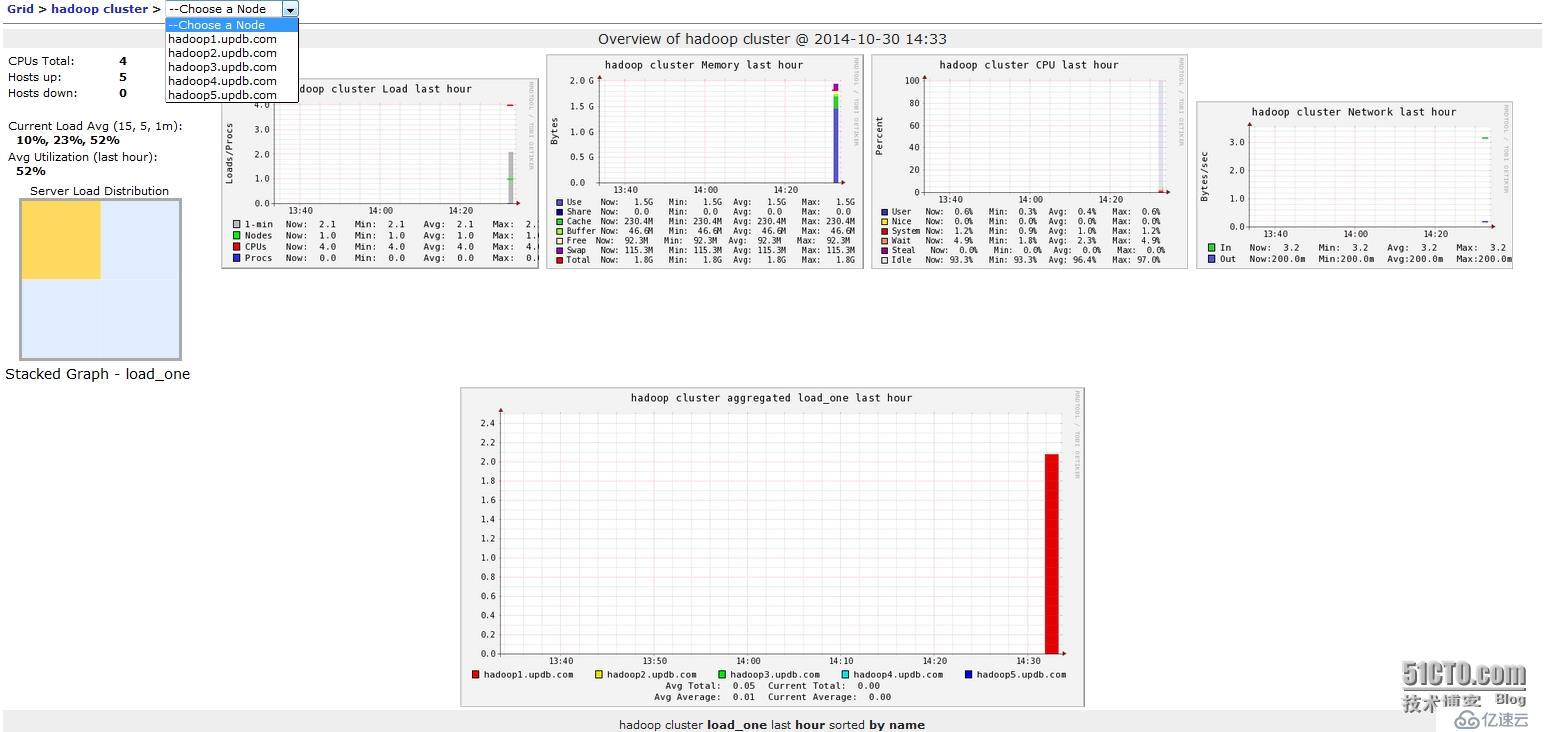
但此时,ganglia只是监控了各主机基本的性能,并没有监控到hadoop和hbase,接下来需要配置hadoop和hbase的配置文件,这里以hadoop1上的配置文件为例,其他节点对应的配置文件应从hadoop1上拷贝,首先需要修改的是hadoop配置目录下的hadoop-metrics2.properties
[root@hadoop1 ~]# cd /opt/hadoop-2.4.1/etc/hadoop/
[root@hadoop1 hadoop]# cat hadoop-metrics2.properties
#
#   Licensed to the Apache Software Foundation (ASF) under one or more
#   contributor license agreements.  See the NOTICE file distributed with
#   this work for additional information regarding copyright ownership.
#   The ASF licenses this file to You under the Apache License, Version 2.0
#   (the "License"); you may not use this file except in compliance with
#   the License.  You may obtain a copy of the License at
#
#       http://www.apache.org/licenses/LICENSE-2.0
#
#   Unless required by applicable law or agreed to in writing, software
#   distributed under the License is distributed on an "AS IS" BASIS,
#   WITHOUT WARRANTIES OR CONDITIONS OF ANY KIND, either express or implied.
#   See the License for the specific language governing permissions and
#   limitations under the License.
#

# syntax: [prefix].[source|sink].[instance].[options]
# See javadoc of package-info.java for org.apache.hadoop.metrics2 for details

#*.sink.file.class=org.apache.hadoop.metrics2.sink.FileSink
# default sampling period, in seconds
#*.period=10

# The namenode-metrics.out will contain metrics from all context
#namenode.sink.file.filename=namenode-metrics.out
# Specifying a special sampling period for namenode:
#namenode.sink.*.period=8

#datanode.sink.file.filename=datanode-metrics.out

# the following example split metrics of different
# context to different sinks (in this case files)
#jobtracker.sink.file_jvm.context=jvm
#jobtracker.sink.file_jvm.filename=jobtracker-jvm-metrics.out
#jobtracker.sink.file_mapred.context=mapred
#jobtracker.sink.file_mapred.filename=jobtracker-mapred-metrics.out

#tasktracker.sink.file.filename=tasktracker-metrics.out

#maptask.sink.file.filename=maptask-metrics.out

#reducetask.sink.file.filename=reducetask-metrics.out

*.sink.ganglia.class=org.apache.hadoop.metrics2.sink.ganglia.GangliaSink31
*.sink.ganglia.period=10
*.sink.ganglia.supportsparse=true
*.sink.ganglia.slope=jvm.metrics.gcCount=zero,jvm.metrics.memHeapUsedM=both
*.sink.ganglia.dmax=jvm.metrics.threadsBlocked=70,jvm.metrics.memHeapUsedM=40
namenode.sink.ganglia.servers=192.168.0.101:8649
datanode.sink.ganglia.servers=192.168.0.101:8649
resourcemanager.sink.ganglia.servers=192.168.0.101:8649
secondarynamenode.sink.ganglia.servers=192.168.0.101:8649
nodemanager.sink.ganglia.servers=192.168.0.101:8649接着需要修改hbase配置目录下的hadoop-metrics2-hbase.properties
[root@hadoop1 hadoop]# cd /opt/hbase-0.98.4-hadoop2/conf/
[root@hadoop1 conf]# cat hadoop-metrics2-hbase.properties
# syntax: [prefix].[source|sink].[instance].[options]
# See javadoc of package-info.java for org.apache.hadoop.metrics2 for details

#*.sink.file*.class=org.apache.hadoop.metrics2.sink.FileSink
# default sampling period
#*.period=10

# Below are some examples of sinks that could be used
# to monitor different hbase daemons.

# hbase.sink.file-all.class=org.apache.hadoop.metrics2.sink.FileSink
# hbase.sink.file-all.filename=all.metrics

# hbase.sink.file0.class=org.apache.hadoop.metrics2.sink.FileSink
# hbase.sink.file0.context=hmaster
# hbase.sink.file0.filename=master.metrics

# hbase.sink.file1.class=org.apache.hadoop.metrics2.sink.FileSink
# hbase.sink.file1.context=thrift-one
# hbase.sink.file1.filename=thrift-one.metrics

# hbase.sink.file2.class=org.apache.hadoop.metrics2.sink.FileSink
# hbase.sink.file2.context=thrift-two
# hbase.sink.file2.filename=thrift-one.metrics

# hbase.sink.file3.class=org.apache.hadoop.metrics2.sink.FileSink
# hbase.sink.file3.context=rest
# hbase.sink.file3.filename=rest.metrics
*.sink.ganglia.class=org.apache.hadoop.metrics2.sink.ganglia.GangliaSink31
*.sink.ganglia.period=10
hbase.sink.ganglia.period=10
hbase.sink.ganglia.servers=192.168.0.101:8649将hadoop1上的这两个文件,scp到hadoop2~5这4个节点上相同的路径下,覆盖原来的文件,然后重启hadoop、hbase,这时ganglia就能够监控到hadoop和hbase了,如下如

到这里位置ganglia已经完全安装配置完成了,且已经成功的监控到了hadoop和hbase。
接下来,安装nagios,在hadoop1上安装nagios服务端、在hadoop2、hadoop3、hadoop4、hadoop5上安装客户端nrpe。
首先在hadoop1上安装nagios、及相关插件
yum install nagios nagios-plugins nagios-plugins-all nagios-plugins-nrpe -y设置nagios web界面的登录口令
[root@hadoop1 ~]# cat /etc/httpd/conf.d/nagios.conf
# SAMPLE CONFIG SNIPPETS FOR APACHE WEB SERVER
# Last Modified: 11-26-2005
#
# This file contains examples of entries that need
# to be incorporated into your Apache web server
# configuration file.  Customize the paths, etc. as
# needed to fit your system.

ScriptAlias /nagios/cgi-bin/ "/usr/lib64/nagios/cgi-bin/"

<Directory "/usr/lib64/nagios/cgi-bin/">
#  SSLRequireSSL
   Options ExecCGI
   AllowOverride None
   Order allow,deny
   Allow from all
#  Order deny,allow
#  Deny from all
#  Allow from 127.0.0.1
## 这里的用户名必须是nagiosadmin
   AuthName "nagiosadmin"
   AuthType Basic
## 这里指定密码文件的路径
   AuthUserFile /etc/nagios/htpasswd.users
   Require valid-user
</Directory>

Alias /nagios "/usr/share/nagios/html"

<Directory "/usr/share/nagios/html">
#  SSLRequireSSL
   Options None
   AllowOverride None
   Order allow,deny
   Allow from all
#  Order deny,allow
#  Deny from all
#  Allow from 127.0.0.1
## 这里的用户名必须是nagiosadmin
   AuthName "nagiosadmin"
   AuthType Basic
## 这里指定密码文件的路径
   AuthUserFile /etc/nagios/htpasswd.users
   Require valid-user
</Directory>保存,退出,生成密码文件
[root@hadoop1 ~]#  htpasswd -c /etc/nagios/htpasswd.users nagiosadmin
New password:
Re-type new password:
Adding password for user nagiosadmin

[root@hadoop1 ~]# cat   /etc/nagios/htpasswd.users
nagiosadmin:qWrXYKDlycqHM生成密码成功,接着在hadoop2、hadoop3、hadoop4、hadoop5上安装客户端nrpe及相关插件
yum install nagios-plugins nagios-plugins-nrpe nrpe nagios-plugins-all -y所有节点的插件均位于/usr/lib64/nagios/plugins/下
[root@hadoop2 ~]# ls /usr/lib64/nagios/plugins/
check_breeze    check_game       check_mrtgtraf     check_overcr   check_swap
check_by_ssh    check_hpjd       check_mysql        check_pgsql    check_tcp
check_clamd     check_http       check_mysql_query  check_ping     check_time
check_cluster   check_icmp       check_nagios       check_pop      check_udp
check_dhcp      check_ide_smart  check_nntp         check_procs    check_ups
check_dig       check_imap       check_nntps        check_real     check_users
check_disk      check_ircd       check_nrpe         check_rpc      check_wave
check_disk_smb  check_jabber     check_nt           check_sensors  negate
check_dns       check_ldap       check_ntp          check_simap    urlize
check_dummy     check_ldaps      check_ntp_peer     check_smtp     utils.pm
check_file_age  check_load       check_ntp.pl       check_snmp     utils.sh
check_flexlm    check_log        check_ntp_time     check_spop
check_fping     check_mailq      check_nwstat       check_ssh
check_ftp check_mrtg check_oracle check_ssmtp要想让nagios与ganglia整合起来,就需要在hadoop1上把ganglia安装包中的ganglia的插件放到nagios的插件目录下
[root@hadoop1 ~]# cd /opt/soft/ganglia-3.6.0/
[root@hadoop1 ganglia-3.6.0]# ls contrib/check_ganglia.py
contrib/check_ganglia.py
[root@hadoop1 ganglia-3.6.0]# cp contrib/check_ganglia.py /usr/lib64/nagios/plugins/ 默认的check_ganglia.py 插件中只有监控项的实际值大于critical阀值的情况,这里需要增加监控项的实际值小于critical阀值的情况,即最后添加的一段代码
[root@hadoop1 plugins]# cat check_ganglia.py
#!/usr/bin/env python

import sys
import getopt
import socket
import xml.parsers.expat

class GParser:
  def __init__(self, host, metric):
    self.inhost =0
    self.inmetric = 0
    self.value = None
    self.host = host
    self.metric = metric

  def parse(self, file):
    p = xml.parsers.expat.ParserCreate()
    p.StartElementHandler = parser.start_element
    p.EndElementHandler = parser.end_element
    p.ParseFile(file)
    if self.value == None:
      raise Exception('Host/value not found')
    return float(self.value)

  def start_element(self, name, attrs):
    if name == "HOST":
      if attrs["NAME"]==self.host:
        self.inhost=1
    elif self.inhost==1 and name == "METRIC" and attrs["NAME"]==self.metric:
      self.value=attrs["VAL"]

  def end_element(self, name):
    if name == "HOST" and self.inhost==1:
      self.inhost=0

def usage():
  print """Usage: check_ganglia \
-h|--host= -m|--metric= -w|--warning= \
-c|--critical= [-s|--server=] [-p|--port=] """
  sys.exit(3)

if __name__ == "__main__":
##############################################################
  ganglia_host = '192.168.0.101'
  ganglia_port = 8649
  host = None
  metric = None
  warning = None
  critical = None

  try:
    options, args = getopt.getopt(sys.argv[1:],
      "h:m:w:c:s:p:",
      ["host=", "metric=", "warning=", "critical=", "server=", "port="],
      )
  except getopt.GetoptError, err:
    print "check_gmond:", str(err)
    usage()
    sys.exit(3)

  for o, a in options:
    if o in ("-h", "--host"):
       host = a
    elif o in ("-m", "--metric"):
       metric = a
    elif o in ("-w", "--warning"):
       warning = float(a)
    elif o in ("-c", "--critical"):
       critical = float(a)
    elif o in ("-p", "--port"):
       ganglia_port = int(a)
    elif o in ("-s", "--server"):
       ganglia_host = a

  if critical == None or warning == None or metric == None or host == None:
    usage()
    sys.exit(3)

  try:
    s = socket.socket(socket.AF_INET, socket.SOCK_STREAM)
    s.connect((ganglia_host,ganglia_port))
    parser = GParser(host, metric)
    value = parser.parse(s.makefile("r"))
    s.close()
  except Exception, err:
    print "CHECKGANGLIA UNKNOWN: Error while getting value \"%s\"" % (err)
    sys.exit(3)

  if critical > warning:
    if value >= critical:
      print "CHECKGANGLIA CRITICAL: %s is %.2f" % (metric, value)
      sys.exit(2)
    elif value >= warning:
      print "CHECKGANGLIA WARNING: %s is %.2f" % (metric, value)
      sys.exit(1)
    else:
      print "CHECKGANGLIA OK: %s is %.2f" % (metric, value)
      sys.exit(0)
  else:
    if critical >=value:
      print "CHECKGANGLIA CRITICAL: %s is %.2f" % (metric, value)
      sys.exit(2)
    elif warning >=value:
      print "CHECKGANGLIA WARNING: %s is %.2f" % (metric, value)
      sys.exit(1)
    else:
      print "CHECKGANGLIA OK: %s is %.2f" % (metric, value)
sys.exit(0)配置hadoop2、hadoop3、hadoop4、hadoop5上的nrpe客户端,这里以hadoop2为例演示,其他节点直接从hadoop2上scp,然后覆盖相同路径的下的文件即可
[root@hadoop2 ~]# cat /etc/nagios/nrpe.cfg
log_facility=daemon
pid_file=/var/run/nrpe/nrpe.pid
## nagios的监听端口
server_port=5666
nrpe_user=nrpe
nrpe_group=nrpe
## nagios服务器主机地址
allowed_hosts=192.168.0.101
dont_blame_nrpe=0
allow_bash_command_substitution=0
debug=0
command_timeout=60
connection_timeout=300

## 监控负载
command[check_load]=/usr/lib64/nagios/plugins/check_load -w 15,10,5 -c 30,25,20
## 当前系统用户数
command[check_users]=/usr/lib64/nagios/plugins/check_users -w 5 -c 10
## 根分区空闲容量
command[check_sda2]=/usr/lib64/nagios/plugins/check_disk -w 20% -c 10% -p /dev/sda2
## mysql状态
command[check_mysql]=/usr/lib64/nagios/plugins/check_mysql -H hadoop2.updb.com -P 3306 -d kora -u kora -p upbjsxt
## 主机是否存活
command[check_ping]=/usr/lib64/nagios/plugins/check_ping -H hadoop2.updb.com -w  100.0,20% -c  500.0,60%
## 当前系统的进程总数
command[check_total_procs]=/usr/lib64/nagios/plugins/check_procs -w 150 -c 200

include_dir=/etc/nrpe.d/scp该文件到hadoop3、hadoop4、hadoop5上相同路径下覆盖源文件,注意要将文件中的主机名改为对应的主机名。
hadoop1上配置各个主机及对应的监控项,有如下配置文件
[root@hadoop1 plugins]# cd /etc/nagios/objects/
## 每个节点对应一个host文件和一个监控项文件,如hadoop2对应的是hadoop2.cfg和service2.cfg
[root@hadoop1 objects]# ls
commands.cfg  hadoop3.cfg  localhost.cfg  service3.cfg  templates.cfg
contacts.cfg  hadoop4.cfg  printer.cfg    service4.cfg  timeperiods.cfg
hadoop1.cfg   hadoop5.cfg  service1.cfg   service5.cfg  windows.cfg
hadoop2.cfg hosts.cfg service2.cfg switch.cfg首先在commond.cfg中声明check_ganglia、check_nrpe命令,在文件最后追加如下内容
# 'check_ganglia' command definition
define command{
        command_name    check_ganglia
        command_line    $USER1$/check_ganglia.py -h $HOSTADDRESS$ -m $ARG1$ -w $ARG2$ -c $ARG3$
        }

# 'check_nrpe' command definition
define command{
        command_name    check_nrpe
        command_line    $USER1$/check_nrpe -H $HOSTADDRESS$ -c $ARG1$
}然后修改templates.cfg模版配置文件,在最后追加如下内容
define service {
        use generic-service
        name ganglia-service1    ## 这里的配置在service1.cfg中用到
        hostgroup_name hadoop1    ## 这里的配置在hadoop1.cfg中用到
        service_groups ganglia-metrics1    ## 这里的配置在service1.cfg中用到
        register        0
}

define service {
        use generic-service
        name ganglia-service2    ## 这里的配置在service2.cfg中用到
        hostgroup_name hadoop2    ## 这里的配置在hadoop2.cfg中用到
        service_groups ganglia-metrics2    ## 这里的配置在service2.cfg中用到
        register        0
}
define service {
        use generic-service
        name ganglia-service3    ## 这里的配置在service3.cfg中用到
        hostgroup_name hadoop3    ## 这里的配置在hadoop3.cfg中用到
        service_groups ganglia-metrics3    ## 这里的配置在service3.cfg中用到
        register        0
}
define service {
        use generic-service
        name ganglia-service4    ## 这里的配置在service4.cfg中用到
        hostgroup_name hadoop4    ## 这里的配置在hadoop4.cfg中用到
        service_groups ganglia-metrics4    ## 这里的配置在service4.cfg中用到
        register        0
}
define service {
        use generic-service
        name ganglia-service5    ## 这里的配置在service5.cfg中用到
        hostgroup_name hadoop5    ## 这里的配置在hadoop5.cfg中用到
        service_groups ganglia-metrics5    ## 这里的配置在service5.cfg中用到
        register        0
}hadoop1的配置如下,由于hadoop1是服务端,无需使用nrpe来监控自己,配置如下
## hadoop1.cfg中的监控项为常规的本机监控项,而service1.cfg中的监控项为ganglia的监控项
[root@hadoop1 objects]# cat hadoop1.cfg
define host{
        use                     linux-server
        host_name               hadoop1.updb.com
        alias                   hadoop1.updb.com
        address                 hadoop1.updb.com
        }

define hostgroup {
        hostgroup_name  hadoop1
        alias  hadoop1
        members hadoop1.updb.com
        }
define service{
        use                             local-service
        host_name                       hadoop1.updb.com
        service_description             PING
        check_command                   check_ping!100,20%!500,60%
        }

define service{
        use                             local-service
        host_name                       hadoop1.updb.com
        service_description             根分区
        check_command                   check_local_disk!20%!10%!/
#       contact_groups                  admins
        }

define service{
        use                             local-service
        host_name                       hadoop1.updb.com
        service_description             用户数量
        check_command                   check_local_users!20!50
        }

define service{
        use                             local-service
        host_name                       hadoop1.updb.com
        service_description             进程数
        check_command                   check_local_procs!250!400!RSZDT
        }

define service{
        use                             local-service
        host_name                       hadoop1.updb.com
        service_description             系统负载
        check_command                   check_local_load!5.0,4.0,3.0!10.0,6.0,4.0
}

## services.cfg
[root@hadoop1 objects]# cat  service1.cfg
define servicegroup {
        servicegroup_name ganglia-metrics1
        alias Ganglia Metrics1
}
## 这里的check_ganglia为commonds.cfg中声明的check_ganglia命令
define service{
        use                             ganglia-service1
        service_description             HMaster负载
        check_command                   check_ganglia!master.Server.averageLoad!5!10
}

define service{
        use                             ganglia-service1
        service_description             内存空闲
        check_command                   check_ganglia!mem_free!200!50
}

define service{
        use                             ganglia-service1
        service_description             NameNode同步
        check_command                   check_ganglia!dfs.namenode.SyncsAvgTime!10!50
}hadoop2的配置如下,需要注意使用check_nrpe插件的监控项必须要在hadoop2上的nrpe.cfg中声明
## 这里的监控项就使用了远程客户端节点上的nrpe来收集数据并周期性的发送给hadoop1的nagios server
[root@hadoop1 objects]# cat hadoop2.cfg
define host{
        use                     linux-server
        host_name               hadoop2.updb.com
        alias                   hadoop2.updb.com
        address                 hadoop2.updb.com
        }

define hostgroup {
        hostgroup_name  hadoop2
        alias  hadoop2
        members hadoop2.updb.com
        }
## 这里的check_nrpe为commonds.cfg中声明的check_nrpe
define service{
        use                             local-service
        host_name                       hadoop2.updb.com
        service_description             Mysql状态
        check_command                   check_nrpe!check_mysql
        }

define service{
        use                             local-service
        host_name                       hadoop2.updb.com
        service_description             PING
        check_command                   check_nrpe!check_ping
        }

define service{
        use                             local-service
        host_name                       hadoop2.updb.com
        service_description             根分区
        check_command                   check_nrpe!check_sda2
        }

define service{
        use                             local-service
        host_name                       hadoop2.updb.com
        service_description             用户数量
        check_command                   check_nrpe!check_users
        }

define service{
        use                             local-service
        host_name                       hadoop2.updb.com
        service_description             进程数
        check_command                   check_nrpe!check_total_procs
        }

define service{
        use                             local-service
        host_name                       hadoop2.updb.com
        service_description             系统负载
        check_command                   check_nrpe!check_load
}

## 这里的监控项为ganglia的监控项使用check_ganglia插件
[root@hadoop1 objects]# cat service2.cfg
define servicegroup {
        servicegroup_name ganglia-metrics2
        alias Ganglia Metrics2
}

define service{
        use                             ganglia-service2
        service_description             内存空闲
        check_command                   check_ganglia!mem_free!200!50
}

define service{
        use                             ganglia-service2
        service_description             RegionServer_Get
        check_command                   check_ganglia!regionserver.Server.Get_min!5!15
}

define service{
        use                             ganglia-service2
        service_description             DateNode_Heartbeat
        check_command                   check_ganglia!dfs.datanode.HeartbeatsAvgTime!15!40
}hadoop3、hadoop4、hadoop5的配置与hadoop2一样,除了主机名要改之外。
最后,还要将这些配置include到nagios的主配置文件中去
## 涉及修改的内容如下,其他的保持不变即可
[root@hadoop1 objects]# vi  ../nagios.cfg
# You can specify individual object config files as shown below:
#cfg_file=/etc/nagios/objects/localhost.cfg
cfg_file=/etc/nagios/objects/commands.cfg
cfg_file=/etc/nagios/objects/contacts.cfg
cfg_file=/etc/nagios/objects/timeperiods.cfg
cfg_file=/etc/nagios/objects/templates.cfg
## 将host文件引入进来
cfg_file=/etc/nagios/objects/hadoop1.cfg
cfg_file=/etc/nagios/objects/hadoop2.cfg
cfg_file=/etc/nagios/objects/hadoop3.cfg
cfg_file=/etc/nagios/objects/hadoop4.cfg
cfg_file=/etc/nagios/objects/hadoop5.cfg
## 将监控项的文件引入进来
cfg_file=/etc/nagios/objects/service1.cfg
cfg_file=/etc/nagios/objects/service2.cfg
cfg_file=/etc/nagios/objects/service3.cfg
cfg_file=/etc/nagios/objects/service4.cfg
cfg_file=/etc/nagios/objects/service5.cfg接下来验证,配置项是否正确
[root@hadoop1 objects]# nagios -v ../nagios.cfg

Nagios Core 3.5.1
Copyright (c) 2009-2011 Nagios Core Development Team and Community Contributors
Copyright (c) 1999-2009 Ethan Galstad
Last Modified: 08-30-2013
License: GPL

Website: http://www.nagios.org
Reading configuration data...
   Read main config file okay...
Processing object config file '/etc/nagios/objects/commands.cfg'...
Processing object config file '/etc/nagios/objects/contacts.cfg'...
Processing object config file '/etc/nagios/objects/timeperiods.cfg'...
Processing object config file '/etc/nagios/objects/templates.cfg'...
Processing object config file '/etc/nagios/objects/hadoop1.cfg'...
Processing object config file '/etc/nagios/objects/hadoop2.cfg'...
Processing object config file '/etc/nagios/objects/hadoop3.cfg'...
Processing object config file '/etc/nagios/objects/hadoop4.cfg'...
Processing object config file '/etc/nagios/objects/hadoop5.cfg'...
Processing object config file '/etc/nagios/objects/service1.cfg'...
Processing object config file '/etc/nagios/objects/service2.cfg'...
Processing object config file '/etc/nagios/objects/service3.cfg'...
Processing object config file '/etc/nagios/objects/service4.cfg'...
Processing object config file '/etc/nagios/objects/service5.cfg'...
Processing object config directory '/etc/nagios/conf.d'...
   Read object config files okay...

Running pre-flight check on configuration data...

Checking services...
        Checked 44 services.
Checking hosts...
        Checked 5 hosts.
Checking host groups...
        Checked 5 host groups.
Checking service groups...
        Checked 5 service groups.
Checking contacts...
        Checked 1 contacts.
Checking contact groups...
        Checked 1 contact groups.
Checking service escalations...
        Checked 0 service escalations.
Checking service dependencies...
        Checked 0 service dependencies.
Checking host escalations...
        Checked 0 host escalations.
Checking host dependencies...
        Checked 0 host dependencies.
Checking commands...
        Checked 26 commands.
Checking time periods...
        Checked 5 time periods.
Checking for circular paths between hosts...
Checking for circular host and service dependencies...
Checking global event handlers...
Checking obsessive compulsive processor commands...
Checking misc settings...

Total Warnings: 0
Total Errors:   0

Things look okay - No serious problems were detected during the pre-flight checkok,没有错误,这时就可以启动hadoop1上的nagios服务
[root@hadoop1 objects]# /etc/init.d/nagios start
Starting nagios: done.启动hadoop2-5上的nrpe服务
[root@hadoop2 ~]# /etc/init.d/nrpe   start
Starting nrpe: [ OK ]在hadoop1上测试nagios与nrpe通信是否正常
[root@hadoop1 objects]# cd /usr/lib64/nagios/plugins/
[root@hadoop1 plugins]# ./check_nrpe -H hadoop1.updb.com
[root@hadoop1 plugins]# ./check_nrpe -H hadoop2.updb.com
NRPE v2.15
[root@hadoop1 plugins]# ./check_nrpe -H hadoop3.updb.com
NRPE v2.15
[root@hadoop1 plugins]# ./check_nrpe -H hadoop4.updb.com
NRPE v2.15
[root@hadoop1 plugins]# ./check_nrpe -H hadoop5.updb.com
NRPE v2.15ok,通信正常,验证check_ganglia.py插件是否工作正常
[root@hadoop1 ~]# cd /usr/lib64/nagios/plugins/
[root@hadoop1 plugins]# ./check_ganglia.py -h hadoop2.updb.com -m mem_free -w 200 -c 50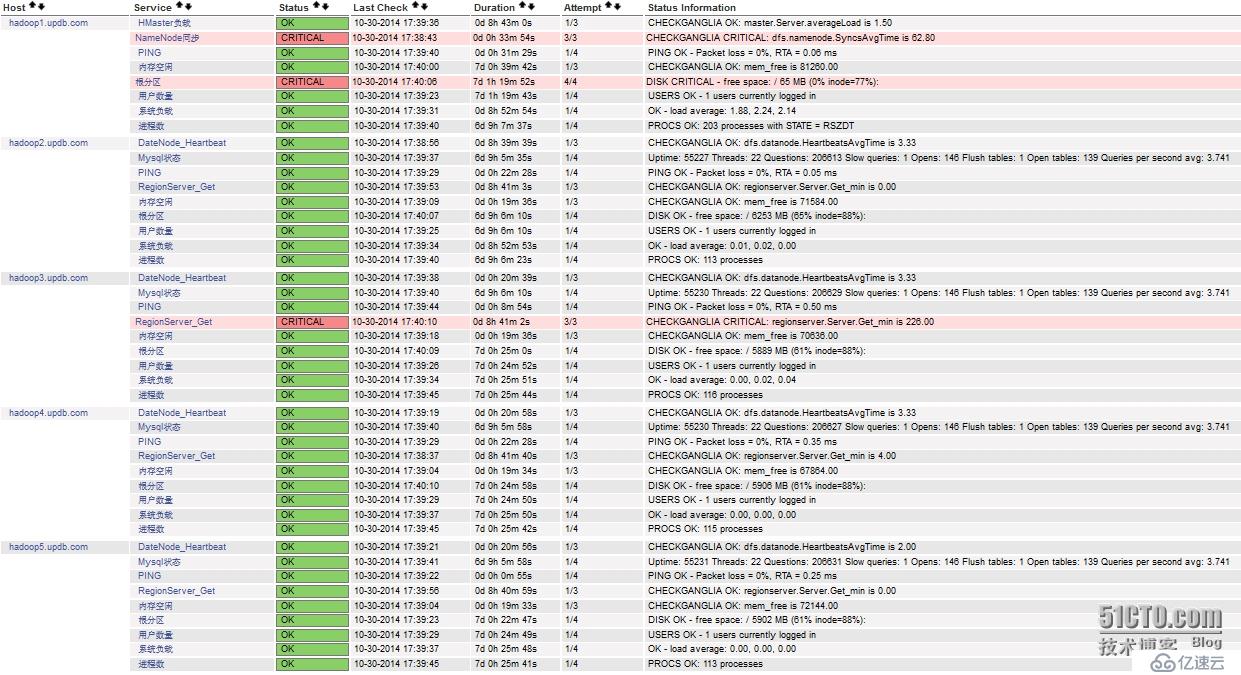
CHECKGANGLIA OK: mem_free is 72336.00工作正常,现在我们可以nagios的web页面,看是否监控成功。
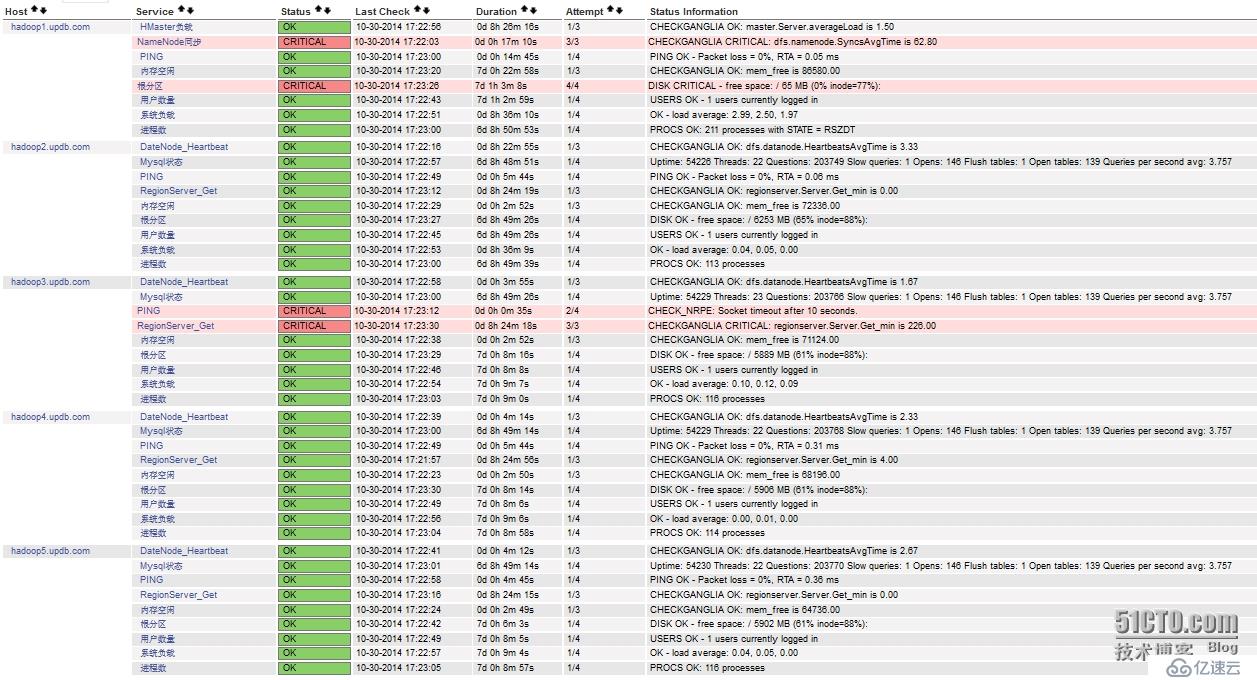
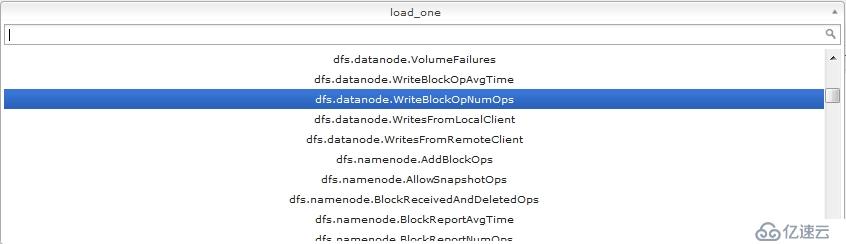
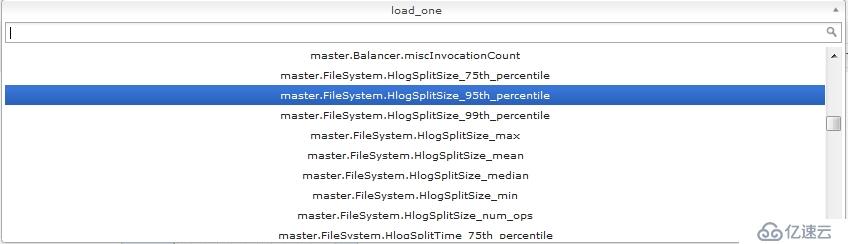
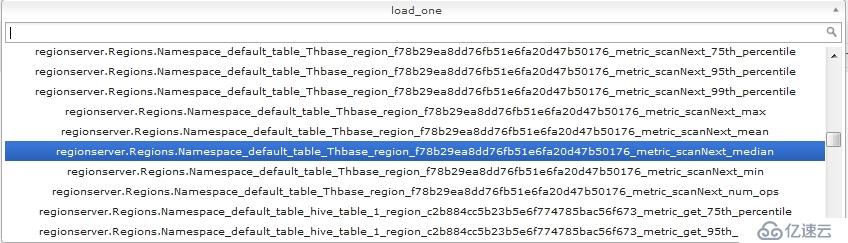
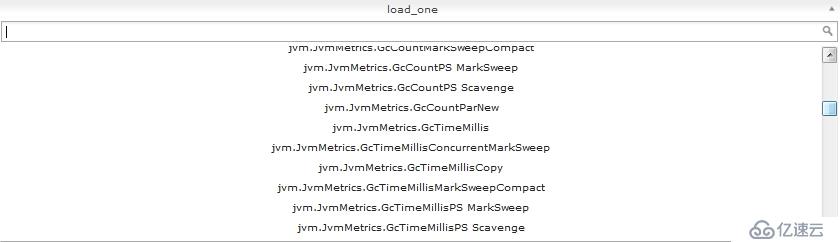
可以看到已经成功监控,如果需要监控hadoop、hbase更多更加详细的监控项,可以在这里查找,nagios中配置监控项的名字和这里出现的一致即可

你会发现,ganglia中出现的可监控项非常的多,只要你愿意,你可以监控任何你想要监控的集群选项,前提是要弄明白这些监控项的含义,以及阀值设置为多少最为合适,显然这才是真正的挑战,实验中的集群监控项我是随便选取的,并没有特别的含义,因为鄙人也还是屌丝一枚,正在慢慢学习这些监控项,好了,到这里nagios已经成功监控到了我们想要监控的内容了,那么怎么实现手机短信报警呢?
看下面,首先我们要配置contacts.cfg,添加邮件的接受人
[root@hadoop1 plugins]# cd /etc/nagios/objects/
[root@hadoop1 objects]# cat contacts.cfg
define contact{
        contact_name                    nagiosadmin
        use                             generic-contact
        alias                           Nagios Admin
        ## 告警时间段
        service_notification_period     24x7
        host_notification_period        24x7
        ## 告警信息格式
        service_notification_options    w,u,c,r,f,s
        host_notification_options       d,u,r,f,s
        ## 告警方式为邮件
        service_notification_commands   notify-service-by-email
        host_notification_commands      notify-host-by-email
        ## 联系人的139邮箱
        email                           1820280----@139.com
        }

## 定义联系人所属组
define contactgroup{
        contactgroup_name       admins
        alias                   Nagios Administrators
        members                 nagiosadmin
}重启nagios服务,要保证你的139邮箱开启了长短信转发格式,确保邮件到达邮箱后会转发到你的手机,这里上一张手机接受到邮件后的截图:
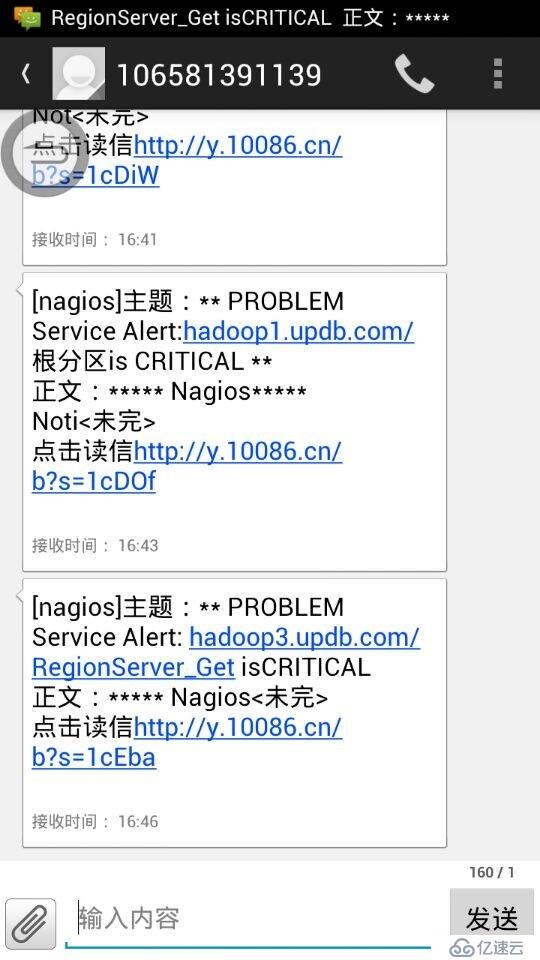
好了,大功告成。看到此刻的你,是否犹如孙悟空的精魂刚刚回归肉体,与周围的世界有片刻的神离。哈哈,好好学习ganglia的监控项,以后嘛嘛就再也不用担心你的运维工作了,上班时间就是喝茶看新闻了,坐等短信告诉你哪个地方有问题。
亿速云「云服务器」,即开即用、新一代英特尔至强铂金CPU、三副本存储NVMe SSD云盘,价格低至29元/月。点击查看>>
免责声明:本站发布的内容(图片、视频和文字)以原创、转载和分享为主,文章观点不代表本网站立场,如果涉及侵权请联系站长邮箱:is@yisu.com进行举报,并提供相关证据,一经查实,将立刻删除涉嫌侵权内容。


 计算
计算 安全
安全 数据库
数据库 网络和加速
网络和加速 企业服务
企业服务


