这篇文章将为大家详细讲解有关如何在python中实现高斯分布概率密度,文章内容质量较高,因此小编分享给大家做个参考,希望大家阅读完这篇文章后对相关知识有一定的了解。
如下所示:
import matplotlib.pyplot as plt
import numpy as np
from scipy import stats
from matplotlib import style
style.use('fivethirtyeight')
mu_params = [-1, 0, 1]
sd_params = [0.5, 1, 1.5]
x = np.linspace(-7, 7, 100)
f, ax = plt.subplots(len(mu_params), len(sd_params), sharex=True, sharey=True, figsize=(12,8))
for i in range(3):
  for j in range(3):
    mu = mu_params[i]
    sd = sd_params[j]
    y = stats.norm(mu, sd).pdf(x)
    ax[i, j].plot(x, y)
    ax[i, j].plot(0,0, label='mu={:3.2f}\nsigma={:3.2f}'.format(mu,sd), alpha=0)
    ax[i, j].legend(fontsize=10)
ax[2,1].set_xlabel('x', fontsize=16)
ax[1,0].set_ylabel('pdf(x)', fontsize=16)
plt.suptitle('Gaussian PDF', fontsize=16)
plt.tight_layout()
plt.show()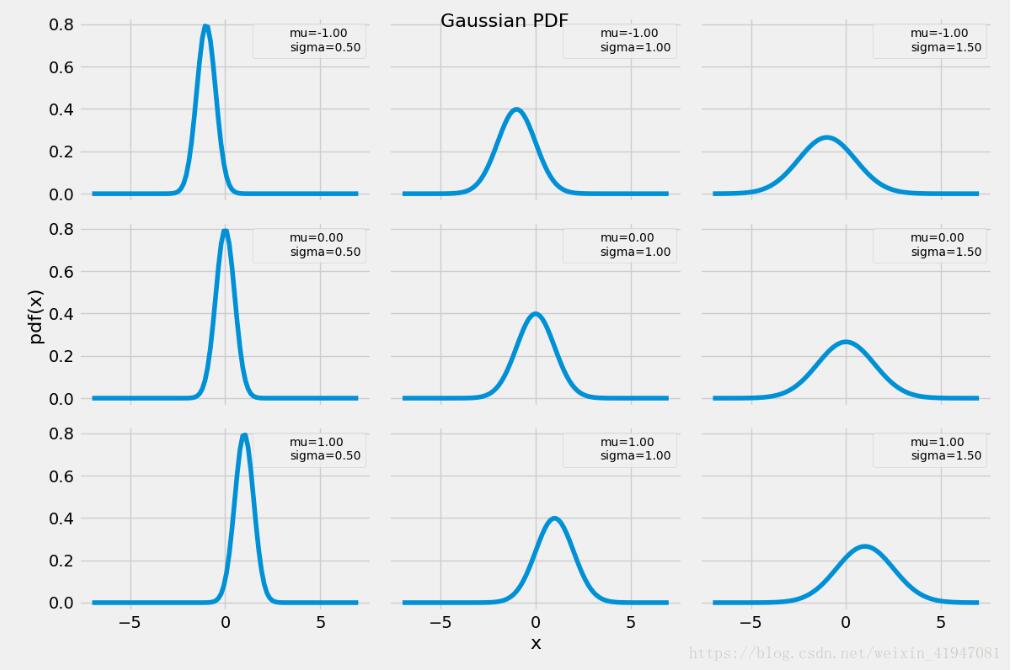
关于如何在python中实现高斯分布概率密度就分享到这里了,希望以上内容可以对大家有一定的帮助,可以学到更多知识。如果觉得文章不错,可以把它分享出去让更多的人看到。
亿速云「云服务器」,即开即用、新一代英特尔至强铂金CPU、三副本存储NVMe SSD云盘,价格低至29元/月。点击查看>>
免责声明:本站发布的内容(图片、视频和文字)以原创、转载和分享为主,文章观点不代表本网站立场,如果涉及侵权请联系站长邮箱:is@yisu.com进行举报,并提供相关证据,一经查实,将立刻删除涉嫌侵权内容。


 计算
计算 安全
安全 数据库
数据库 网络和加速
网络和加速 企业服务
企业服务


