这篇文章给大家分享的是有关如何通过python的matplotlib包将Tensorflow数据进行可视化的内容。小编觉得挺实用的,因此分享给大家做个参考,一起跟随小编过来看看吧。
使用matplotlib中的一些函数将tensorflow中的数据可视化,更加便于分析
import tensorflow as tf
import numpy as np
import matplotlib.pyplot as plt
def add_layer(inputs, in_size, out_size, activation_function=None):
Weights = tf.Variable(tf.random_normal([in_size, out_size]))
biases = tf.Variable(tf.zeros([1, out_size]) + 0.1)
Wx_plus_b = tf.matmul(inputs, Weights) + biases
if activation_function is None:
outputs = Wx_plus_b
else:
outputs = activation_function(Wx_plus_b)
return outputs
# Make up some real data
x_data = np.linspace(-1, 1, 300)[:, np.newaxis]
noise = np.random.normal(0, 0.05, x_data.shape)
y_data = np.square(x_data) - 0.5 + noise
# define placeholder for inputs to network
xs = tf.placeholder(tf.float32, [None, 1])
ys = tf.placeholder(tf.float32, [None, 1])
# add hidden layer
l1 = add_layer(xs, 1, 10, activation_function=tf.nn.relu)
# add output layer
prediction = add_layer(l1, 10, 1, activation_function=None)
# the error between prediction and real data
loss = tf.reduce_mean(tf.reduce_sum(tf.square(ys-prediction), reduction_indices=[1]))
train_step = tf.train.GradientDescentOptimizer(0.1).minimize(loss)
# important step
#initialize_all_variables已被弃用,使用tf.global_variables_initializer代替。
init = tf.global_variables_initializer()
sess = tf.Session()
sess.run(init)
# plot the real data
fig = plt.figure()
ax = fig.add_subplot(1,1,1)
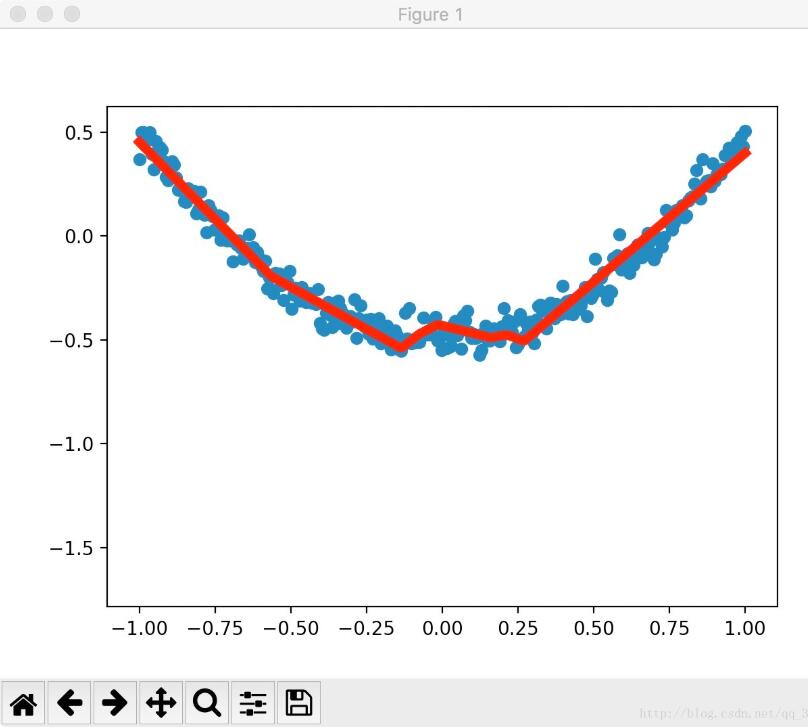
ax.scatter(x_data, y_data)
plt.ion() #使plt不会在show之后停止而是继续运行
plt.show()
for i in range(1000):
# training
sess.run(train_step, feed_dict={xs: x_data, ys: y_data})
if i % 50 == 0:
# to visualize the result and improvement
try:
ax.lines.remove(lines[0]) #在每一次绘图之前先讲上一次绘图删除,使得画面更加清晰
except Exception:
pass
prediction_value = sess.run(prediction, feed_dict={xs: x_data})
# plot the prediction
lines = ax.plot(x_data, prediction_value, 'r-', lw=5) #'r-'指绘制一个红色的线
plt.pause(1) #指等待一秒钟运行结果如下:(实际效果应该是动态的,应当使用ipython运行,使用jupyter运行则图片不是动态的)
注意:initialize_all_variables已被弃用,使用tf.global_variables_initializer代替。
感谢各位的阅读!关于“如何通过python的matplotlib包将Tensorflow数据进行可视化”这篇文章就分享到这里了,希望以上内容可以对大家有一定的帮助,让大家可以学到更多知识,如果觉得文章不错,可以把它分享出去让更多的人看到吧!
亿速云「云服务器」,即开即用、新一代英特尔至强铂金CPU、三副本存储NVMe SSD云盘,价格低至29元/月。点击查看>>
免责声明:本站发布的内容(图片、视频和文字)以原创、转载和分享为主,文章观点不代表本网站立场,如果涉及侵权请联系站长邮箱:is@yisu.com进行举报,并提供相关证据,一经查实,将立刻删除涉嫌侵权内容。


 计算
计算 安全
安全 数据库
数据库 网络和加速
网络和加速 企业服务
企业服务


