这篇文章给大家分享的是有关Python数据分析之双色球统计两个红和蓝球哪组合比例高的示例分析的内容。小编觉得挺实用的,因此分享给大家做个参考,一起跟随小编过来看看吧。
具体如下:
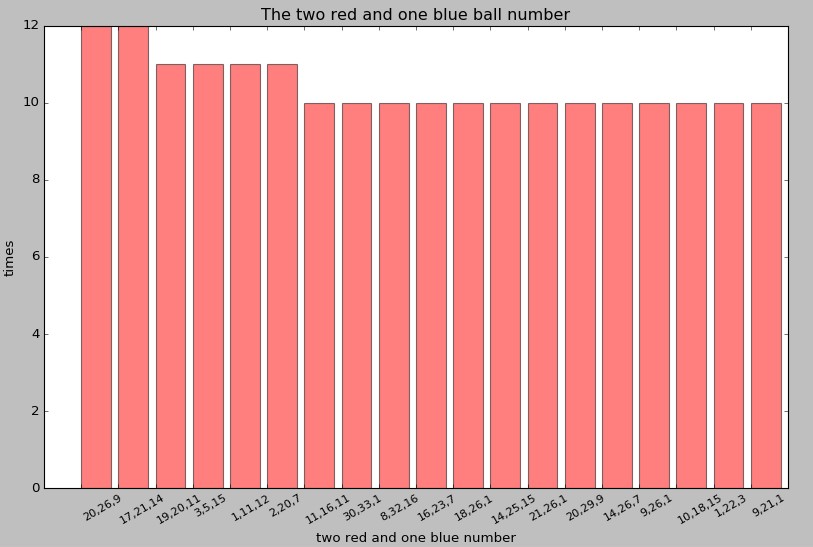
统计两个红球和蓝球,哪个组合最多,显示前19组数据
#!/usr/bin/python
# -*- coding:UTF-8 -*-
import pandas as pd
import numpy as np
import matplotlib.pyplot as plt
import operator
#导入数据
df = pd.read_table('newdata.txt',header=None,sep=',')
tdate = sorted(df.loc[:,0])
# print tdate
#第1、2列的红球
h2 = df.loc[:,1:2].values
# print h2
#第2、3列的红球
h3 = df.loc[:,2:3].values
#第3、4列的红球
h4 = df.loc[:,3:4].values
#第4、5列的红球
h5 = df.loc[:,4:5].values
#第5、6列的红球
h6 = df.loc[:,5:6].values
#蓝球
b1 = df.loc[:,7:7].values
# print b1
#第1、3列红球
h7 = df.loc[:,1:3:2].values
h7 = df.loc[:,1:4:3].values
h8 = df.loc[:,1:5:4].values
h9 = df.loc[:,1:6:5].values
h20 = df.loc[:,2:4:2].values
h21 = df.loc[:,2:5:3].values
h22 = df.loc[:,2:6:4].values
h23 = df.loc[:,3:5:2].values
h24 = df.loc[:,3:6:3].values
#第4、6列红球
h25 = df.loc[:,4:6:2].values
#将蓝球添加到各红球组中(有2列数据变为3列数据),之后将所有数据按列向合并
data2 = np.append(h2, b1, axis=1)
for i in [h3,h4,h5,h6,h7,h7,h8,h9,h20,h21,h22,h23,h24,h25]:
  data1 = np.append(i, b1, axis=1)
  data2 = np.append(data2, data1, axis=0)
print data2
data1 = pd.DataFrame(data2)
#写入到2hldata.csv文件中
data1.to_csv('2hldata.csv',index=None,header=None)
#读取文件,进行统计,并且从大倒小排序
f = open("2hldata.csv")
count_dict = {}
for line in f.readlines():
  line = line.strip()
  count = count_dict.setdefault(line, 0)
  count += 1
  count_dict[line] = count
sorted_count_dict = sorted(count_dict.iteritems(), key=operator.itemgetter(1), reverse=True)
# for item in sorted_count_dict:
#   print "%s,%d" % (item[0], item[1])
#重置DataFrame的index
fenzu = pd.DataFrame(sorted_count_dict).set_index([0])
print fenzu
x = list(fenzu.index[:19])
y = list(fenzu.values[:19])
print x
print y
#将index替换成数值,便于画图使用
s = pd.Series(range(1,len(x)+1), index=x)
plt.figure(figsize=(12,8),dpi=80)
plt.legend(loc='best')
plt.bar(s,y,alpha=.5, color='r',width=0.8)
plt.title('The two red and one blue ball number')
plt.xlabel('two red and one blue number')
plt.ylabel('times')
#将原来index的内容显示出来
plt.xticks(s,x, rotation=30,size=10,ha='left')
plt.show()
显示结果:

可以看出红球20、26和蓝球9以及红球17、21和蓝球14,出现次数最多12次
后期的3红球和蓝球,4红球和蓝球,5红球和蓝球,6红球和蓝球的统计,基本思路一致。
感谢各位的阅读!关于“Python数据分析之双色球统计两个红和蓝球哪组合比例高的示例分析”这篇文章就分享到这里了,希望以上内容可以对大家有一定的帮助,让大家可以学到更多知识,如果觉得文章不错,可以把它分享出去让更多的人看到吧!
免责声明:本站发布的内容(图片、视频和文字)以原创、转载和分享为主,文章观点不代表本网站立场,如果涉及侵权请联系站长邮箱:is@yisu.com进行举报,并提供相关证据,一经查实,将立刻删除涉嫌侵权内容。