жӮЁеҘҪпјҢзҷ»еҪ•еҗҺжүҚиғҪдёӢи®ўеҚ•е“ҰпјҒ
жӮЁеҘҪпјҢзҷ»еҪ•еҗҺжүҚиғҪдёӢи®ўеҚ•е“ҰпјҒ
жң¬зҜҮеҶ…е®№д»Ӣз»ҚдәҶвҖңVue-cli3дёӯжҖҺд№Ҳеј•е…ҘECharts并е®һзҺ°иҮӘйҖӮеә”вҖқзҡ„жңүе…ізҹҘиҜҶпјҢеңЁе®һйҷ…жЎҲдҫӢзҡ„ж“ҚдҪңиҝҮзЁӢдёӯпјҢдёҚе°‘дәәйғҪдјҡйҒҮеҲ°иҝҷж ·зҡ„еӣ°еўғпјҢжҺҘдёӢжқҘе°ұи®©е°Ҹзј–еёҰйўҶеӨ§е®¶еӯҰд№ дёҖдёӢеҰӮдҪ•еӨ„зҗҶиҝҷдәӣжғ…еҶөеҗ§пјҒеёҢжңӣеӨ§е®¶д»”з»Ҷйҳ…иҜ»пјҢиғҪеӨҹеӯҰжңүжүҖжҲҗпјҒ

1. е®үиЈ…echarts
npm install echarts
2. components/echarts/index.vue
<template>
  <div :class="className" : />
</template>
<script>
import echarts from 'echarts'
require('echarts/theme/macarons') // echarts theme
import {debounce} from '@/utlis/index.js'
const animationDuration = 6000
export default {
props: {
className: {
type: String,
default: 'chart'
},
width: {
type: String,
default: '100%'
},
height: {
type: String,
default: '100%'
},
// ж•°жҚ®жәҗ
echartsData: {
type: Object,
default: {}
},
},
data() {
return {
chart: null,
}
},
watch: {
},
//еҲқе§ӢеҢ–
mounted() {
this.initChart()
this.resizeHandler = debounce(() => {
if (this.chart) {
this.chart.resize()
}
}, 100)
window.addEventListener('resize', this.resizeHandler)
},
//й”ҖжҜҒ
beforeDestroy() {
if (!this.chart) {
return
}
window.removeEventListener('resize', this.resizeHandler)
this.chart.dispose()
this.chart = null
},
methods: {
initChart() {
this.chart = echarts.init(this.$el, 'macarons')
this.chart.setOption(this.echartsData, animationDuration)
}
}
}
</script>3. utlis/index.js
export function debounce(func, wait, immediate) {
let timeout, args, context, timestamp, result
const later = function() {
// жҚ®дёҠдёҖж¬Ўи§ҰеҸ‘ж—¶й—ҙй—ҙйҡ”
const last = +new Date() - timestamp
// дёҠж¬Ўиў«еҢ…иЈ…еҮҪж•°иў«и°ғз”Ёж—¶й—ҙй—ҙйҡ”lastе°ҸдәҺи®ҫе®ҡж—¶й—ҙй—ҙйҡ”wait
if (last < wait && last > 0) {
timeout = setTimeout(later, wait - last)
} else {
timeout = null
// еҰӮжһңи®ҫе®ҡдёәimmediate===trueпјҢеӣ дёәејҖе§Ӣиҫ№з•Ңе·Із»Ҹи°ғз”ЁиҝҮдәҶжӯӨеӨ„ж— йңҖи°ғз”Ё
if (!immediate) {
result = func.apply(context, args)
if (!timeout) context = args = null
}
}
}
return function(...args) {
context = this
timestamp = +new Date()
const callNow = immediate && !timeout
// еҰӮжһң延时дёҚеӯҳеңЁпјҢйҮҚж–°и®ҫе®ҡ延时
if (!timeout) timeout = setTimeout(later, wait)
if (callNow) {
result = func.apply(context, args)
context = args = null
}
return result
}
}4. еңЁ.vue дёӯдҪҝз”Ё test/index.vue
<template>
  <div id="test">
    <echarts :echartsData="echartsData" />
  </div>
</template>
<script>
import echarts from '@/components/echarts/index'
export default {
components: {
echarts
},
data() {
return {
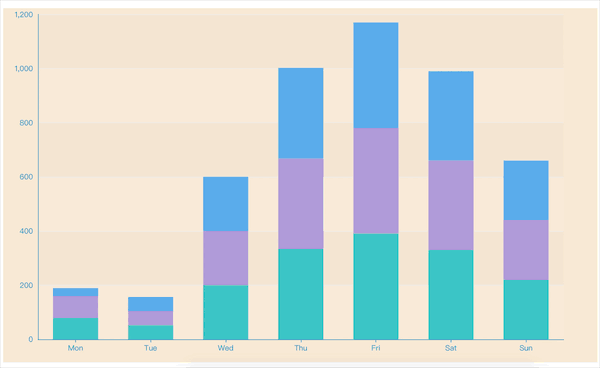
echartsData: {
tooltip: {
trigger: 'axis',
axisPointer: { // еқҗж ҮиҪҙжҢҮзӨәеҷЁпјҢеқҗж ҮиҪҙи§ҰеҸ‘жңүж•Ҳ
type: 'shadow' // й»ҳи®ӨдёәзӣҙзәҝпјҢеҸҜйҖүдёәпјҡ'line' | 'shadow'
}
},
grid: {
top: 10,
left: '2%',
right: '2%',
bottom: '3%',
containLabel: true
},
xAxis: [{
type: 'category',
data: ['Mon', 'Tue', 'Wed', 'Thu', 'Fri', 'Sat', 'Sun'],
axisTick: {
alignWithLabel: true
}
}],
yAxis: [{
type: 'value',
axisTick: {
show: false
}
}],
series: [{
name: 'pageA',
type: 'bar',
stack: 'vistors',
barWidth: '60%',
data: [79, 52, 200, 334, 390, 330, 220],
}, {
name: 'pageB',
type: 'bar',
stack: 'vistors',
barWidth: '60%',
data: [80, 52, 200, 334, 390, 330, 220],
}, {
name: 'pageC',
type: 'bar',
stack: 'vistors',
barWidth: '60%',
data: [30, 52, 200, 334, 390, 330, 220],
}]
}
}
}
}
</script><style lang="scss" scoped>
#test {
width: 100%;
height: 100%;
background: antiquewhite;
position: absolute;
top: 0px;
bottom: 0px;
}
</style>еңЁз»Ҳз«Ҝиҫ“е…Ҙ
cnpm install echarts --save
еңЁmain.jsдёӯеј•е…Ҙ
import * as eCharts from 'echarts';
Vue.prototype.$eCharts = eCharts;
ж–°е»ә组件echats.vue
йҰ–е…Ҳеә”иҜҘжҳҺзЎ®EchartsеӣҫеҪўеҝ…йЎ»ж»Ўи¶іеӣӣйЎ№еҲҡжҖ§жқЎд»¶жүҚеҸҜд»Ҙз»ҳеҲ¶пјҡ
еҮҶеӨҮдёҖдёӘе…·жңүе®Ҫй«ҳзҡ„е®№еҷЁпјҲcontainerпјүпјӣ
жҜҸж¬Ўз»ҳеҲ¶д№ӢеүҚйңҖиҰҒеҲқе§ӢеҢ–пјҲinitпјүпјӣ
еҝ…йЎ»и®ҫзҪ®й…ҚзҪ®пјҢеҗҰеҲҷж— д»Һз»ҳеҲ¶пјҲoptionпјүпјӣ
ж”№еҸҳж•°жҚ®ж—¶еҝ…йЎ»дј е…Ҙж”№еҸҳзҡ„ж•°жҚ®пјҢеҗҰеҲҷзӣ‘еҗ¬дёҚеҲ°ж–°ж•°жҚ®пјҲsetOptionпјүпјӣ
1.е®№еҷЁ
жіЁж„ҸпјҢе®№еҷЁзҡ„е®Ҫй«ҳеҸҜд»ҘйҖҡиҝҮv-bindз»‘е®ҡж ·ејҸзҡ„еҸӮж•°styleObjжқҘи®ҫзҪ®пјҲзҲ¶з»„д»¶еј•з”Ёж—¶дј йҖ’иҝҮжқҘпјүпјҢдҪҝеҫ—еә”з”Ёechats组件时еҸҜд»ҘиҮӘз”ұең°и®ҫзҪ®е®Ҫй«ҳ
<template>
  <div id="myChart" : ref="chart">
  </div>
</template>
2.еҲқе§ӢеҢ–+й…ҚзҪ®
з”ұдәҺеҲқе§ӢеҢ–йңҖиҰҒиҺ·еҸ–еҲ°е®№еҷЁdomпјҢжүҖд»ҘйңҖиҰҒеңЁmoutedз”ҹе‘Ҫе‘ЁжңҹйҮҢйқўеҲқе§ӢеҢ–
mounted () {
// еӣ дёәйңҖиҰҒжӢҝеҲ°е®№еҷЁпјҢжүҖд»ҘиҰҒжҢӮиҪҪд№ӢеҗҺ
this.init()
},
methods: {
init(){
let chart = this.$eCharts.init(this.$refs.chart)
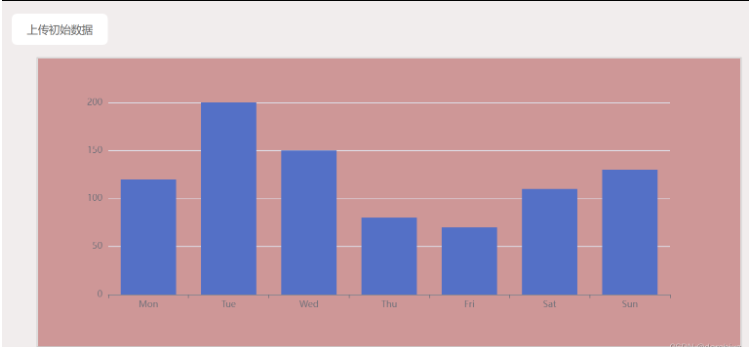
let option = {
xAxis: {
type: 'category',
data: ['Mon', 'Tue', 'Wed', 'Thu', 'Fri', 'Sat', 'Sun'],
}, //XиҪҙ
yAxis: { type: 'value' }, //YиҪҙ
series: [
{
data: [120, 200, 150, 80, 70, 110, 130],
type: 'bar',
}] //й…ҚзҪ®йЎ№
}
chart.setOption(option)
}
}

вҖңVue-cli3дёӯжҖҺд№Ҳеј•е…ҘECharts并е®һзҺ°иҮӘйҖӮеә”вҖқзҡ„еҶ…е®№е°ұд»Ӣз»ҚеҲ°иҝҷйҮҢдәҶпјҢж„ҹи°ўеӨ§е®¶зҡ„йҳ…иҜ»гҖӮеҰӮжһңжғідәҶи§ЈжӣҙеӨҡиЎҢдёҡзӣёе…ізҡ„зҹҘиҜҶеҸҜд»Ҙе…іжіЁдәҝйҖҹдә‘зҪ‘з«ҷпјҢе°Ҹзј–е°ҶдёәеӨ§е®¶иҫ“еҮәжӣҙеӨҡй«ҳиҙЁйҮҸзҡ„е®һз”Ёж–Үз« пјҒ
е…ҚиҙЈеЈ°жҳҺпјҡжң¬з«ҷеҸ‘еёғзҡ„еҶ…е®№пјҲеӣҫзүҮгҖҒи§Ҷйў‘е’Ңж–Үеӯ—пјүд»ҘеҺҹеҲӣгҖҒиҪ¬иҪҪе’ҢеҲҶдә«дёәдё»пјҢж–Үз« и§ӮзӮ№дёҚд»ЈиЎЁжң¬зҪ‘з«ҷз«ӢеңәпјҢеҰӮжһңж¶үеҸҠдҫөжқғиҜ·иҒ”зі»з«ҷй•ҝйӮ®з®ұпјҡis@yisu.comиҝӣиЎҢдёҫжҠҘпјҢ并жҸҗдҫӣзӣёе…іиҜҒжҚ®пјҢдёҖз»ҸжҹҘе®һпјҢе°Ҷз«ӢеҲ»еҲ йҷӨж¶үе«ҢдҫөжқғеҶ…е®№гҖӮ