本篇内容介绍了“R语言怎么实现柱形图”的有关知识,在实际案例的操作过程中,不少人都会遇到这样的困境,接下来就让小编带领大家学习一下如何处理这些情况吧!希望大家仔细阅读,能够学有所成!
df<-readxl::read_excel("example_data/001.xlsx")head(df)dflibrary(dplyr)df%>% group_by(group)%>% summarise(mean_value=mean(value),sd_value=sd(value)) -> df1df1library(ggplot2)ggplot(data=df1,aes(x=group,y=mean_value))+ geom_col(aes(fill=group))+ geom_errorbar(aes(ymin=mean_value-sd_value, ymax=mean_value+sd_value), width=0.2)+ theme_bw()+ scale_y_continuous(expand=c(0,0),limits=c(0,4), breaks = c(0,1,2,3,4))+ scale_fill_manual(values=c("#1f78b4", "#33a02c", "#e31a1c"))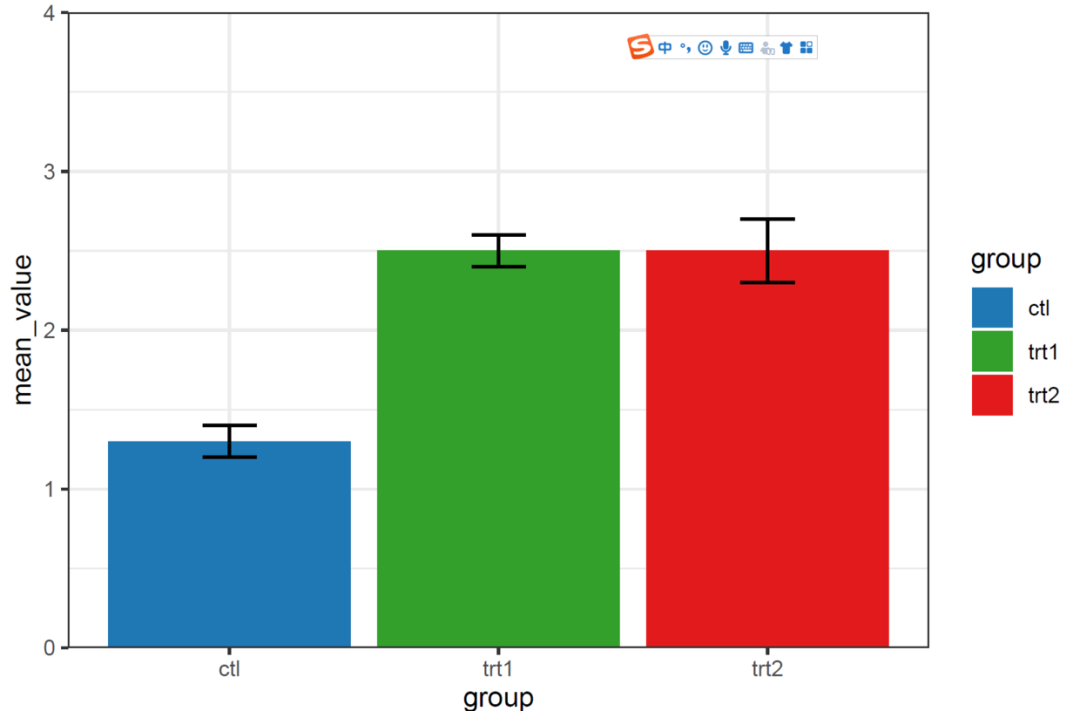
df<-read.csv("example_data/002.csv",header=T)dfggplot(data=df,aes(x=dose,y=len,fill=supp))+ geom_bar(stat="identity",position = "dodge",width=0.5)+ geom_errorbar(aes(ymin=len-sd_value,ymax=len+sd_value),width=0.2, position = position_dodge(0.5))+ theme_bw()+ scale_fill_manual(values=c("#33a02c", "#e31a1c"))+ scale_y_continuous(expand = c(0,0),limits = c(0,40))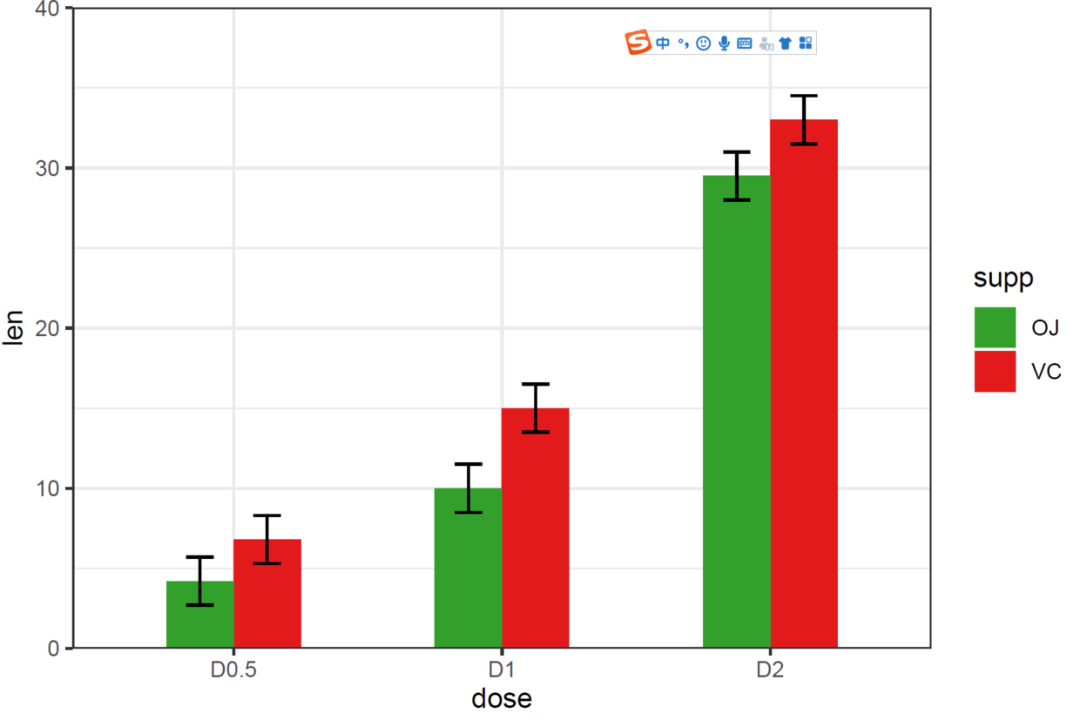
df%>%group_by(dose)%>%mutate(new_col=cumsum(len)) -> df1df1ggplot(data=df1,aes(x=dose,y=len,fill=supp))+ geom_bar(stat="identity",position="stack")+ geom_text(aes(label=len), position = position_stack(vjust=0.5),color="white")+ geom_errorbar(aes(ymin=new_col-sd_value,ymax=new_col+sd_value), width=0.1)+ theme_bw()+scale_fill_manual(values=c("#33a02c", "#e31a1c"))+ scale_y_continuous(expand = c(0,0),limits = c(0,70))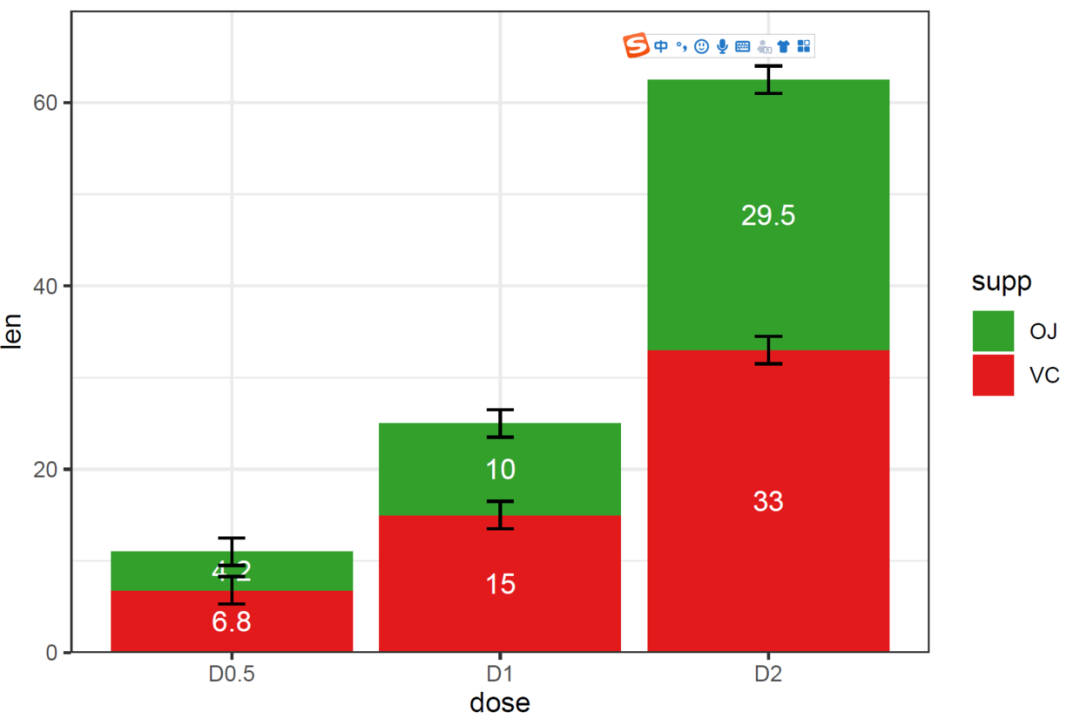
df<-read.csv("example_data/003-1.csv",header=T)dfggplot(data=df,aes(x=dose,y=len,group=1))+ geom_line()+geom_point()+ geom_errorbar(aes(ymin=len-sd_value,ymax=len+sd_value),width=0.05)+ theme_bw()+ geom_text(aes(y=len+sd_value+1,label=Sigi),size=8)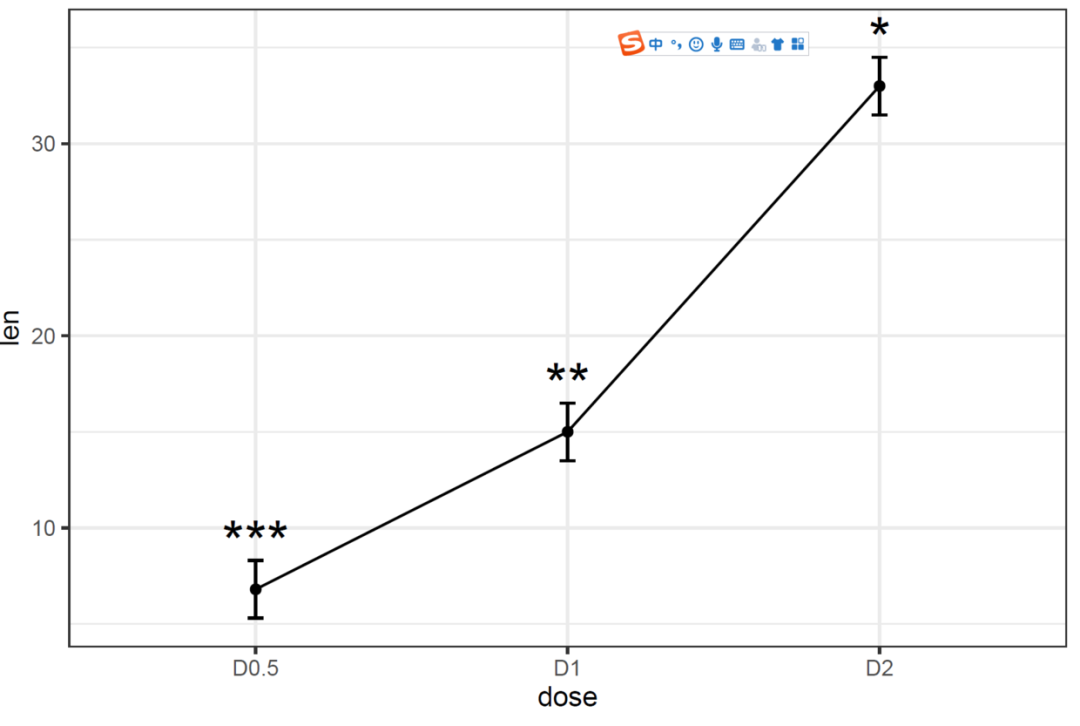
df<-read.csv("example_data/003-2.csv",header=T)dfggplot(data=df,aes(x=dose,y=len,group=supp))+ geom_line(aes(color=supp))+geom_point(aes(color=supp))+ geom_errorbar(aes(ymin=len-sd_value, ymax=len+sd_value,color=supp), width=0.05)+ theme_bw()+ scale_color_manual(values=c("#33a02c", "#e31a1c"))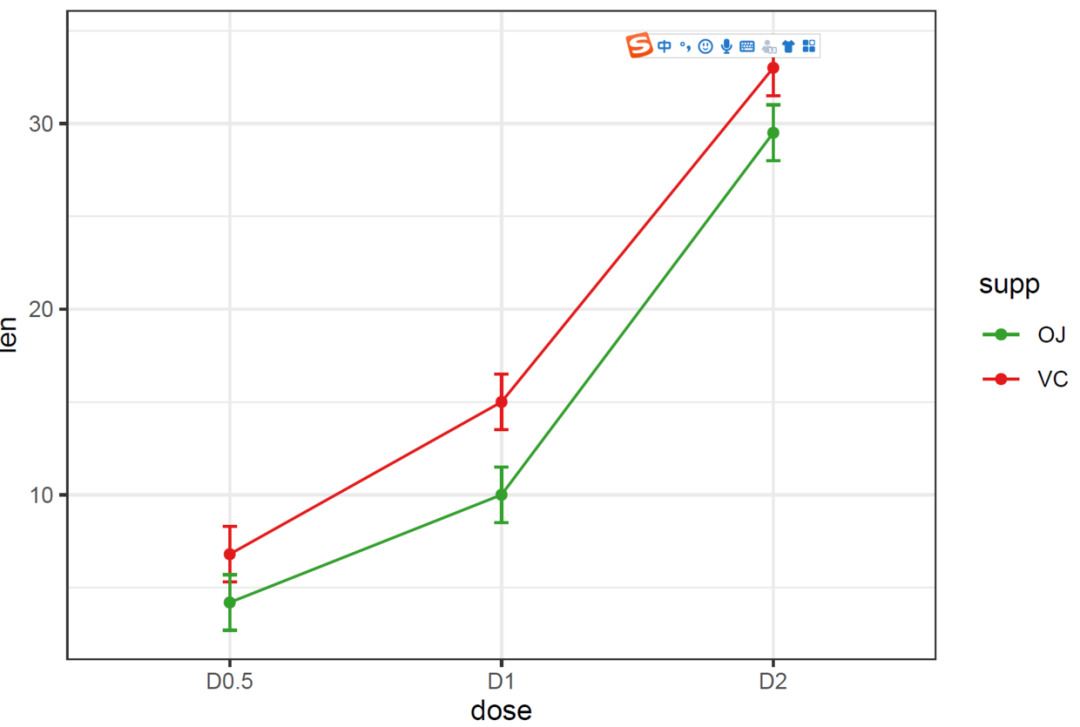
“R语言怎么实现柱形图”的内容就介绍到这里了,感谢大家的阅读。如果想了解更多行业相关的知识可以关注亿速云网站,小编将为大家输出更多高质量的实用文章!
亿速云「云服务器」,即开即用、新一代英特尔至强铂金CPU、三副本存储NVMe SSD云盘,价格低至29元/月。点击查看>>
免责声明:本站发布的内容(图片、视频和文字)以原创、转载和分享为主,文章观点不代表本网站立场,如果涉及侵权请联系站长邮箱:is@yisu.com进行举报,并提供相关证据,一经查实,将立刻删除涉嫌侵权内容。
原文链接:https://my.oschina.net/u/4579431/blog/5009391