今天就跟大家聊聊有关怎么使用R语言ggtree展示进化树,可能很多人都不太了解,为了让大家更加了解,小编给大家总结了以下内容,希望大家根据这篇文章可以有所收获。
今天要模仿的图片来自于论文 Core gut microbial communities are maintained by beneficial interactions and strain variability in fish。期刊是 Nature microbiology
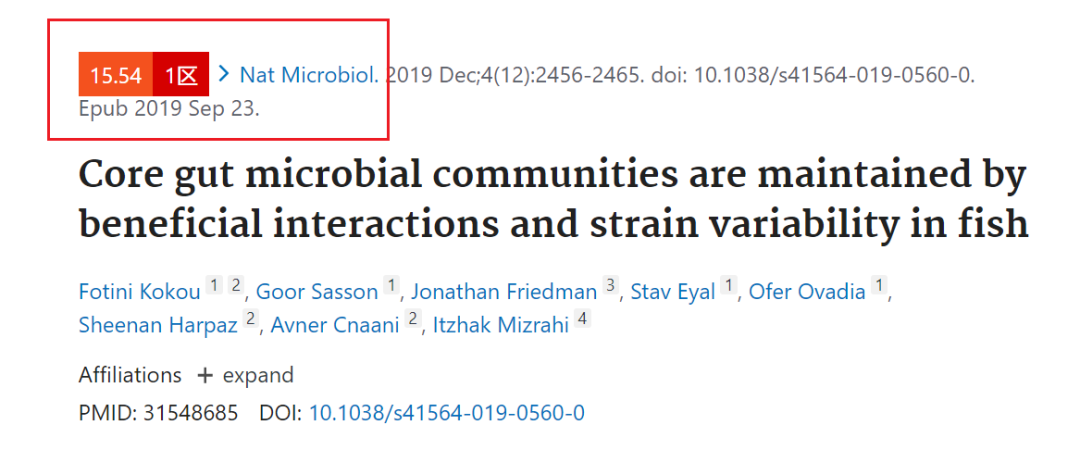
今天重复的图片是Figure1中的聚类树图
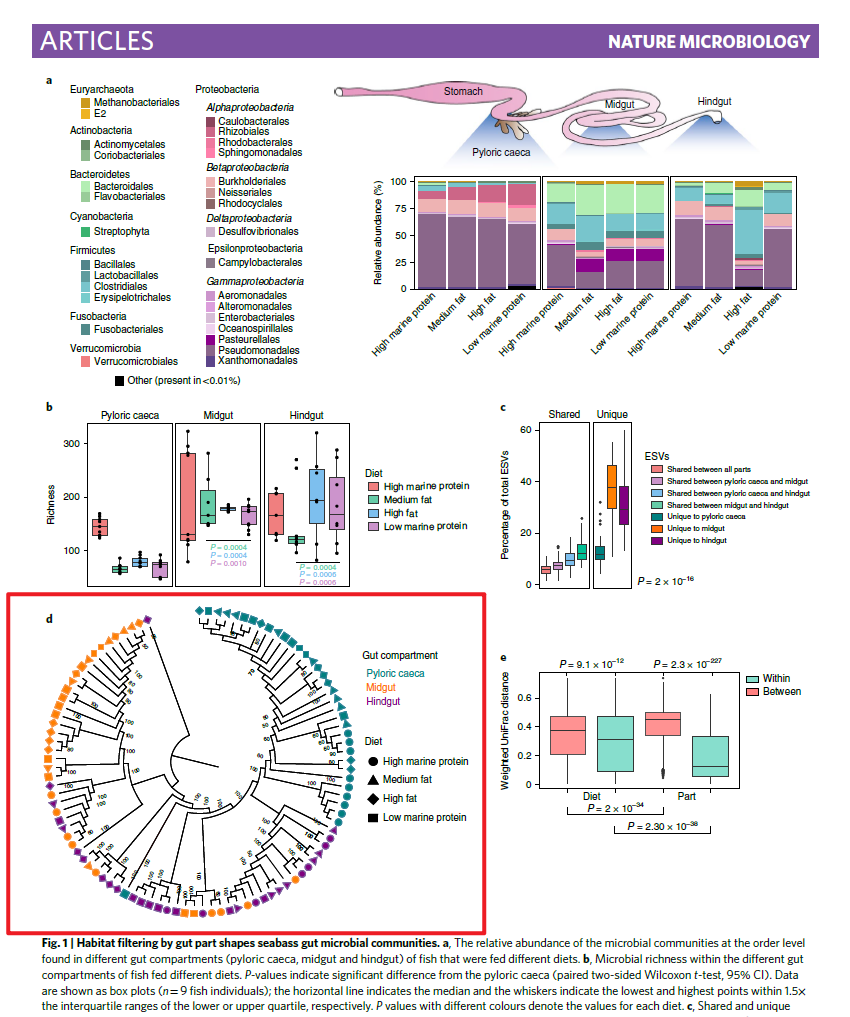
Hierarchical clustering dendrogram with jackknife support (numbers on the branches; only values above 50 are shown in the tree).
所以论文中实际的数据做的是聚类分析,而并不是进化树。他这里做聚类分析也能够获得每个节点对应的支持率。这个如何实现我暂时还不知道。为了模仿这个图,下面的输入数据我直接使用进化树文件了,因为构建进化树的时候能够很方便的获得节点的支持率信息。
这里用到的数据集来自 网址 https://www.kuleuven.be/aidslab/phylogenybook/Data_sets.html
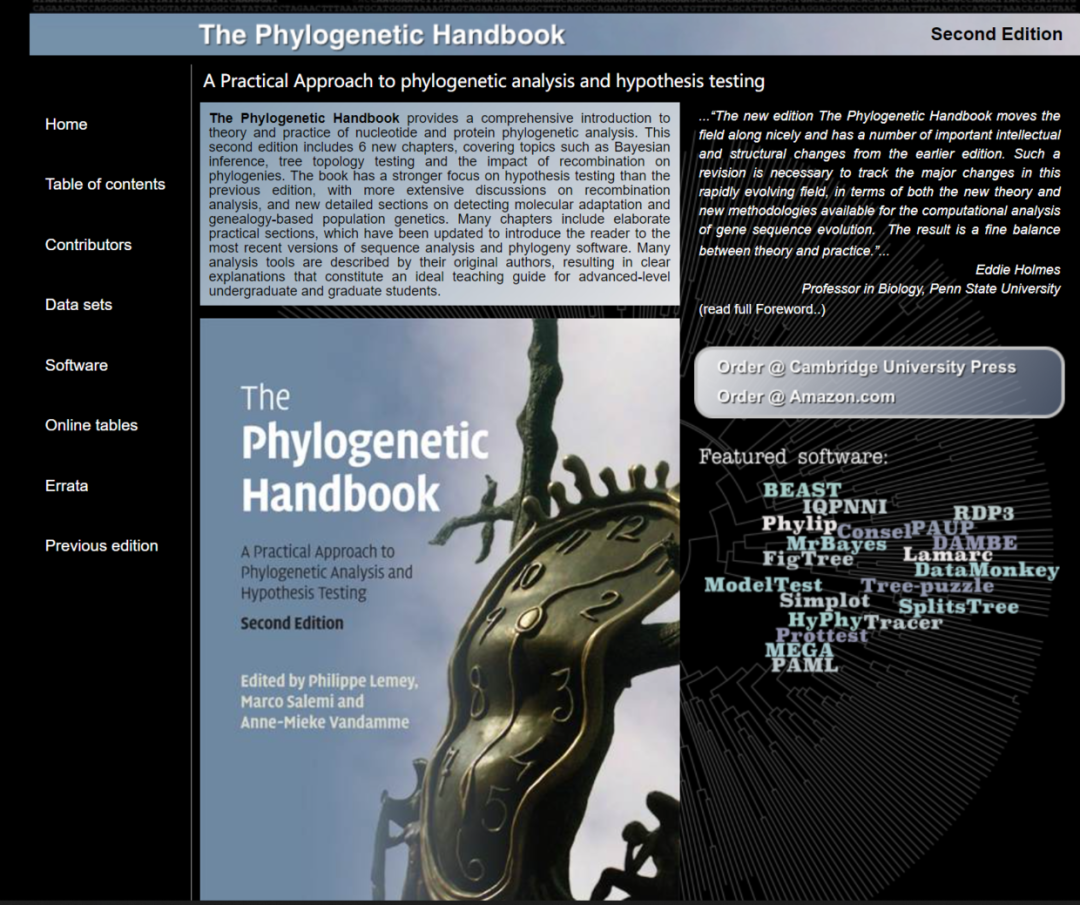
这本 The Phylogenetic Handbook second edition 不知道大家有没有电子版可以分享呀!
mafft --auto ggtree_practice.fasta > ggtree_practice_aligned.fastaiqtree -s ggtree_practice_aligned.fasta -bb 1000得到树文件ggtree_practice_aligned.fasta.treefile
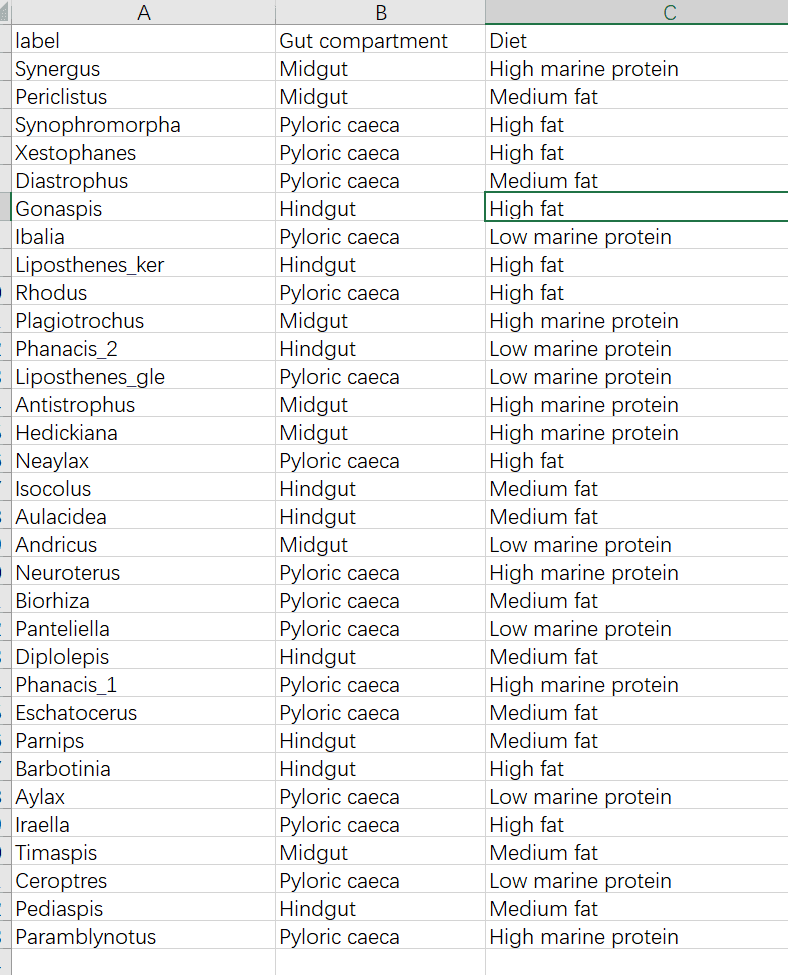
数据总共三列
第二列和第三列的列名就是图例上想显示什么就用什么
library(ggtree)library(treeio)library(tidytree)treeio用来读入进化树tidytree用来将分组信息整合给进化树ggtree用来可视化展示进化树tree<-read.newick("ggtree_practice_aligned.fasta.treefile", node.label = "support")d<-read.csv("ggtree_group_info.csv",header=T)dtrs<-full_join(tree,d,by='label')tree@data$support<-ifelse(tree@data$support<50,NA,tree@data$support)ggtree(trs,layout = "circular",branch.length = "none")+ #geom_tiplab(offset = 0.01)+ geom_tippoint(aes(shape=Diet,color=Gut.compartment), size=5)+ scale_shape_manual(values = c(16,17,18,15))+ geom_text2(aes(label=support,angle=angle),hjust=-0.2)+ scale_color_manual(values = c("#800080","#ff8000","#008080"), name="Gut_compartment")+ guides(color=guide_legend(order = 1))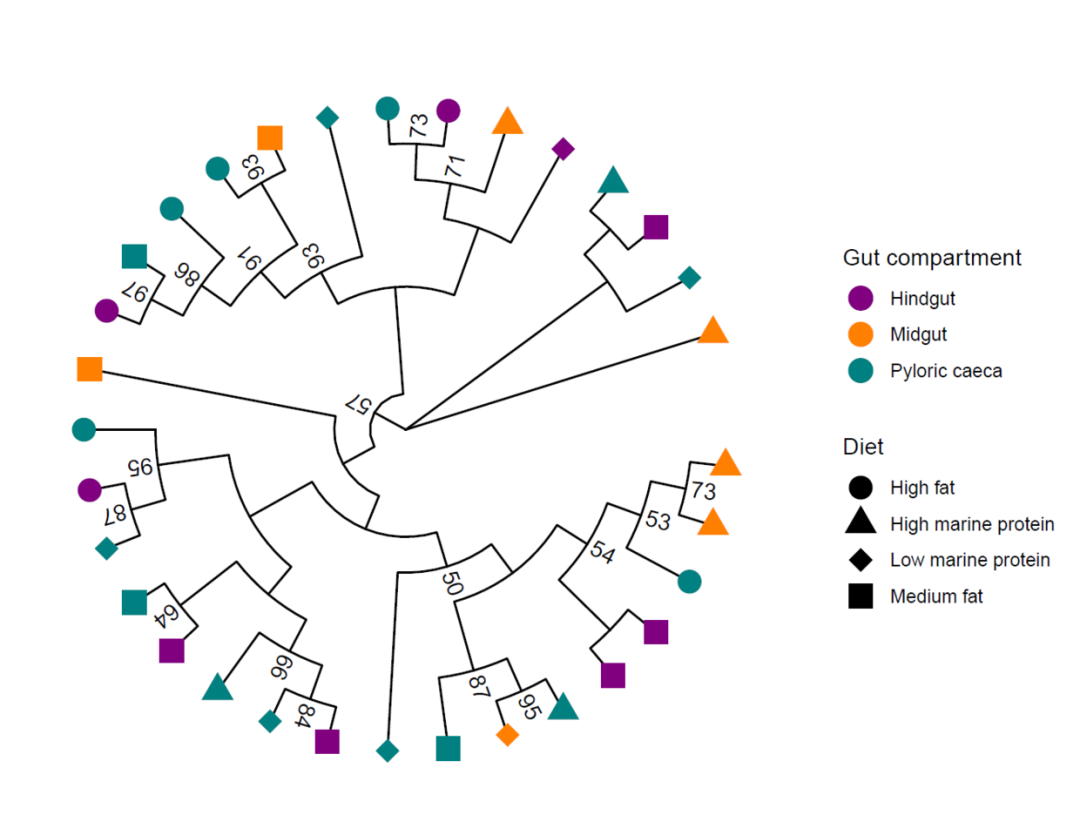 看完上述内容,你们对怎么使用R语言ggtree展示进化树有进一步的了解吗?如果还想了解更多知识或者相关内容,请关注亿速云行业资讯频道,感谢大家的支持。
亿速云「云服务器」,即开即用、新一代英特尔至强铂金CPU、三副本存储NVMe SSD云盘,价格低至29元/月。点击查看>>
免责声明:本站发布的内容(图片、视频和文字)以原创、转载和分享为主,文章观点不代表本网站立场,如果涉及侵权请联系站长邮箱:is@yisu.com进行举报,并提供相关证据,一经查实,将立刻删除涉嫌侵权内容。
原文链接:https://my.oschina.net/u/4579431/blog/4865073


 计算
计算 安全
安全 数据库
数据库 网络和加速
网络和加速 企业服务
企业服务


