本篇内容主要讲解“Echarts怎么通过dataset数据集实现创建单轴散点图”,感兴趣的朋友不妨来看看。本文介绍的方法操作简单快捷,实用性强。下面就让小编来带大家学习“Echarts怎么通过dataset数据集实现创建单轴散点图”吧!
由于使用echarts作图时,我很喜欢用dataset作为数据源,但是官方案例中,又没有给出相关示例,于是,在翻阅官方文档相关案例之后,结合官方文档使用dataset的示例,成功使用dataset绘制单轴散点图!
//配置项
const option = {
    title:[],
    dataset:[
        {
            //使用 dimensions:["week","hours","count"], 方式时,
            //transform识别不到!
            source:[//原始数据集
                ["week","hours","count"],
                [0, 0, 5], [0, 1, 1], [0, 2, 0], [0, 3, 0],
                [0, 4, 0], [0, 5, 0], [0, 6, 0], [0, 7, 0],
                [0, 8, 0], [0, 9, 0], [0, 10, 0], [0, 11, 2],
                [0, 12, 4], [0, 13, 1], [0, 14, 1], [0, 15, 3],
                [0, 16, 4], [0, 17, 6], [0, 18, 4], [0, 19, 4],
                [0, 20, 3], [0, 21, 3], [0, 22, 2], [0, 23, 5],
                [1, 0, 7], [1, 1, 0], [1, 2, 0], [1, 3, 0],
                [1, 4, 0], [1, 5, 0], [1, 6, 0], [1, 7, 0],
                [1, 8, 0], [1, 9, 0], [1, 10, 5], [1, 11, 2],
                [1, 12, 2], [1, 13, 6], [1, 14, 9], [1, 15, 11],
                [1, 16, 6], [1, 17, 7], [1, 18, 8], [1, 19, 12],
                [1, 20, 5], [1, 21, 5], [1, 22, 7], [1, 23, 2],
                [2, 0, 1], [2, 1, 1], [2, 2, 0], [2, 3, 0],
                [2, 4, 0], [2, 5, 0], [2, 6, 0], [2, 7, 0],
                [2, 8, 0], [2, 9, 0], [2, 10, 3], [2, 11, 2],
                [2, 12, 1], [2, 13, 9], [2, 14, 8], [2, 15, 10],
                [2, 16, 6], [2, 17, 5], [2, 18, 5], [2, 19, 5],
                [2, 20, 7], [2, 21, 4], [2, 22, 2], [2, 23, 4],
                [3, 0, 7], [3, 1, 3], [3, 2, 0], [3, 3, 0],
                [3, 4, 0], [3, 5, 0], [3, 6, 0], [3, 7, 0],
                [3, 8, 1], [3, 9, 0], [3, 10, 5], [3, 11, 4],
                [3, 12, 7], [3, 13, 14], [3, 14, 13], [3, 15, 12],
                [3, 16, 9], [3, 17, 5], [3, 18, 5], [3, 19, 10],
                [3, 20, 6], [3, 21, 4], [3, 22, 4], [3, 23, 1],
                [4, 0, 1], [4, 1, 3], [4, 2, 0], [4, 3, 0],
                [4, 4, 0], [4, 5, 1], [4, 6, 0], [4, 7, 0],
                [4, 8, 0], [4, 9, 2], [4, 10, 4], [4, 11, 4],
                [4, 12, 2], [4, 13, 4], [4, 14, 4], [4, 15, 14],
                [4, 16, 12], [4, 17, 1], [4, 18, 8], [4, 19, 5],
                [4, 20, 3], [4, 21, 7], [4, 22, 3], [4, 23, 0],
                [5, 0, 2], [5, 1, 1], [5, 2, 0], [5, 3, 3],
                [5, 4, 0], [5, 5, 0], [5, 6, 0], [5, 7, 0],
                [5, 8, 2], [5, 9, 0], [5, 10, 4], [5, 11, 1],
                [5, 12, 5], [5, 13, 10], [5, 14, 5], [5, 15, 7],
                [5, 16, 11], [5, 17, 6], [5, 18, 0], [5, 19, 5],
                [5, 20, 3], [5, 21, 4], [5, 22, 2], [5, 23, 0],
                [6, 0, 1], [6, 1, 0], [6, 2, 0], [6, 3, 0],
                [6, 4, 0], [6, 5, 0], [6, 6, 0], [6, 7, 0],
                [6, 8, 0], [6, 9, 0], [6, 10, 1], [6, 11, 0],
                [6, 12, 2], [6, 13, 1], [6, 14, 3], [6, 15, 4],
                [6, 16, 0], [6, 17, 0], [6, 18, 0], [6, 19, 0],
                [6, 20, 1], [6, 21, 2], [6, 22, 2], [6, 23, 6]
            ]
        },
    ],
  tooltip: {
    formatter:param=>{
        return `
            week:${week[param.value[0]]}
            <br/>hour:${hours[param.value[1]]}
            <br />count:${param.value[2]}
        `
    },

    position: 'bottom'
  },
  singleAxis: [],//单轴配置
  series: []
}

//24小时数组
const hours = [
    '12a', '1a', '2a', '3a', '4a', '5a', '6a',
    '7a', '8a', '9a', '10a', '11a',
    '12p', '1p', '2p', '3p', '4p', '5p',
    '6p', '7p', '8p', '9p', '10p', '11p'
];

//星期数组
const week = ['Saturday', 'Friday', 'Thursday',
    'Wednesday', 'Tuesday', 'Monday', 'Sunday']


for(let index = 0 ; index <7;index++){
    option.title.push(
        {
            top: ((index + 0.5) * 100) / 7 + '%',//标题显示位置
            text: week[index]//标题
        }
    )
    //通过transform从dataset.source中获取目标数据
    option.dataset.push(
        {
            transform: {
                type: 'filter',//使用transform过滤器
                //条件:week维度值=index的值
                config: { dimension: 'week', value: index },
            }
        },
    );
    option.singleAxis.push(
        {
            left: 150,
            boundaryGap: false,
            //使用24小时数组为刻度
            type: 'category',
            data: hours,

            top: (index * 100) / 7 + 5 + '%',
            height: 100 / 7 - 10 + '%',
            axisLabel: {
                interval: 2,
            }
        }
    );
    option.series.push(
        {
            datasetIndex: index + 1,//使用对应转换好的数据源
            singleAxisIndex: index,
            coordinateSystem: 'singleAxis',
            type: 'scatter',
            encode: {
                //数据的第2列和第三列为展示数据
                //transform数据源["hour","count"]无法识别
                single:[1,2]
            },
            symbolSize: function (dataItem) {
                return dataItem[2] * 4;
            }
        }
    )
}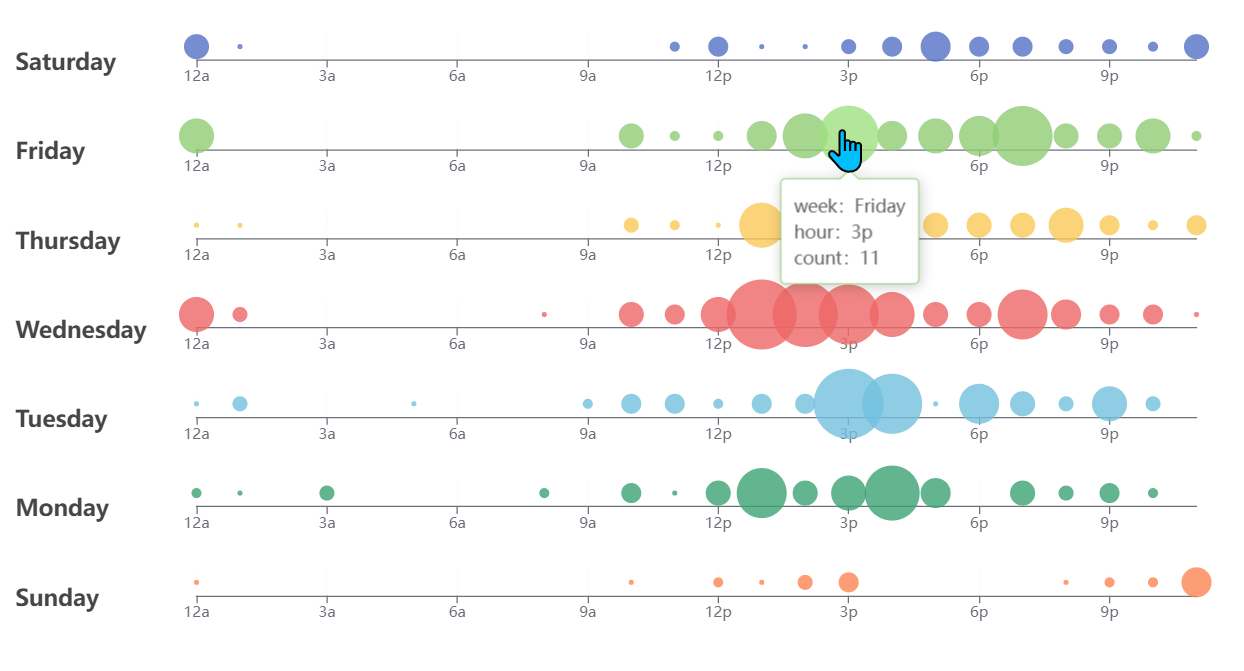
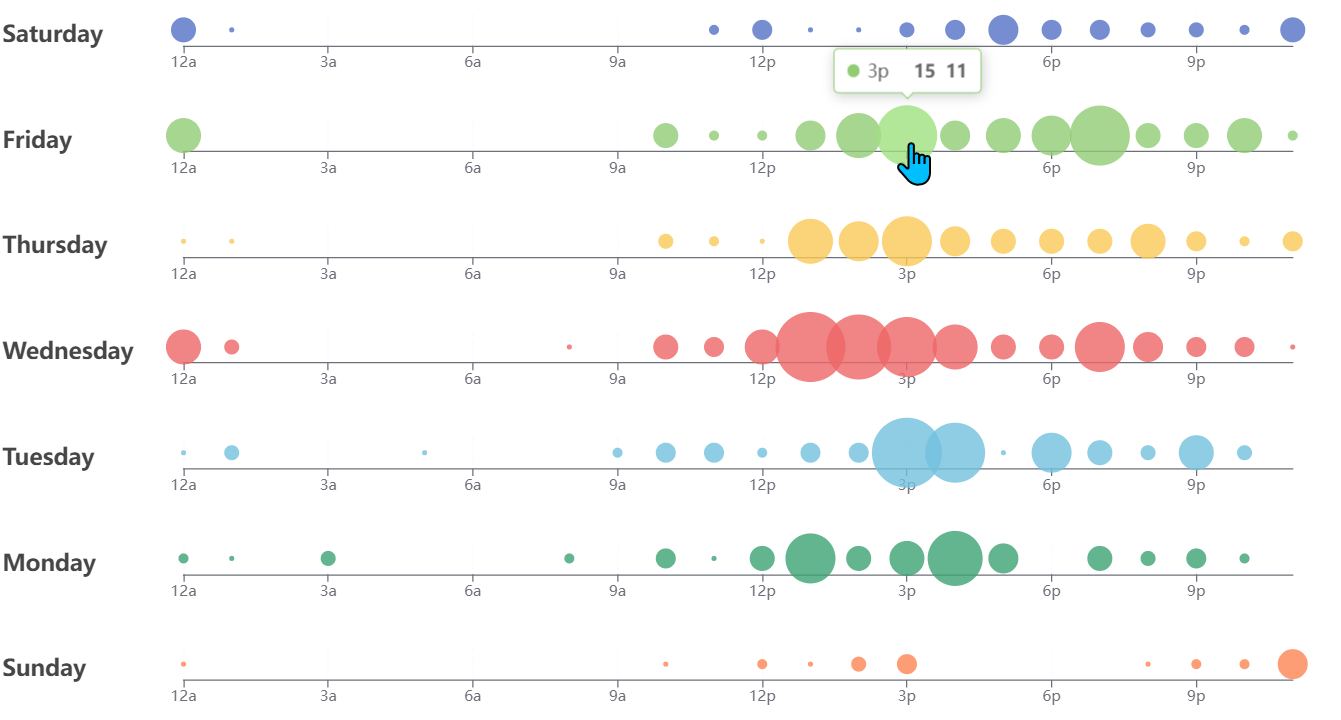
官方案例效果图:
到此,相信大家对“Echarts怎么通过dataset数据集实现创建单轴散点图”有了更深的了解,不妨来实际操作一番吧!这里是亿速云网站,更多相关内容可以进入相关频道进行查询,关注我们,继续学习!
亿速云「云服务器」,即开即用、新一代英特尔至强铂金CPU、三副本存储NVMe SSD云盘,价格低至29元/月。点击查看>>
免责声明:本站发布的内容(图片、视频和文字)以原创、转载和分享为主,文章观点不代表本网站立场,如果涉及侵权请联系站长邮箱:is@yisu.com进行举报,并提供相关证据,一经查实,将立刻删除涉嫌侵权内容。


 计算
计算 安全
安全 数据库
数据库 网络和加速
网络和加速 企业服务
企业服务


