本篇文章给大家分享的是有关python networkx 根据图的权重画图实现,小编觉得挺实用的,因此分享给大家学习,希望大家阅读完这篇文章后可以有所收获,话不多说,跟着小编一起来看看吧。
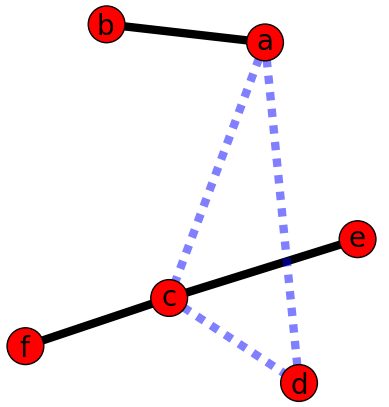
首先输入边和边的权重,随后画出节点位置,根据权重大小划分实边和虚边

#coding:utf-8
#!/usr/bin/env python
"""
An example using Graph as a weighted network.
"""
__author__ = """Aric Hagberg (hagberg@lanl.gov)"""
try:
  import matplotlib.pyplot as plt
except:
  raise

import networkx as nx

G=nx.Graph()
#添加带权边
G.add_edge('a','b',weight=0.6)
G.add_edge('a','c',weight=0.2)
G.add_edge('c','d',weight=0.1)
G.add_edge('c','e',weight=0.7)
G.add_edge('c','f',weight=0.9)
G.add_edge('a','d',weight=0.3)
#按权重划分为重权值得边和轻权值的边
elarge=[(u,v) for (u,v,d) in G.edges(data=True) if d['weight'] >0.5]
esmall=[(u,v) for (u,v,d) in G.edges(data=True) if d['weight'] <=0.5]
#节点位置
pos=nx.spring_layout(G) # positions for all nodes
#首先画出节点位置
# nodes
nx.draw_networkx_nodes(G,pos,node_size=700)
#根据权重,实线为权值大的边,虚线为权值小的边
# edges
nx.draw_networkx_edges(G,pos,edgelist=elarge,
          width=6)
nx.draw_networkx_edges(G,pos,edgelist=esmall,
          width=6,alpha=0.5,edge_color='b',style='dashed')

# labels标签定义
nx.draw_networkx_labels(G,pos,font_size=20,font_family='sans-serif')

plt.axis('off')
plt.savefig("weighted_graph.png") # save as png
plt.show() # display以上就是python networkx 根据图的权重画图实现,小编相信有部分知识点可能是我们日常工作会见到或用到的。希望你能通过这篇文章学到更多知识。更多详情敬请关注亿速云行业资讯频道。
亿速云「云服务器」,即开即用、新一代英特尔至强铂金CPU、三副本存储NVMe SSD云盘,价格低至29元/月。点击查看>>
免责声明:本站发布的内容(图片、视频和文字)以原创、转载和分享为主,文章观点不代表本网站立场,如果涉及侵权请联系站长邮箱:is@yisu.com进行举报,并提供相关证据,一经查实,将立刻删除涉嫌侵权内容。