жӮЁеҘҪпјҢзҷ»еҪ•еҗҺжүҚиғҪдёӢи®ўеҚ•е“ҰпјҒ
жӮЁеҘҪпјҢзҷ»еҪ•еҗҺжүҚиғҪдёӢи®ўеҚ•е“ҰпјҒ
иҝҷзҜҮж–Үз« дё»иҰҒд»Ӣз»ҚдәҶеҰӮдҪ•з”Ёpythonз»ҳеҲ¶жҹұеҪўеӣҫзҡ„зӣёе…ізҹҘиҜҶпјҢеҶ…е®№иҜҰз»Ҷжҳ“жҮӮпјҢж“ҚдҪңз®ҖеҚ•еҝ«жҚ·пјҢе…·жңүдёҖе®ҡеҖҹйүҙд»·еҖјпјҢзӣёдҝЎеӨ§е®¶йҳ…иҜ»е®ҢиҝҷзҜҮеҰӮдҪ•з”Ёpythonз»ҳеҲ¶жҹұеҪўеӣҫж–Үз« йғҪдјҡжңүжүҖ收иҺ·пјҢдёӢйқўжҲ‘们дёҖиө·жқҘзңӢзңӢеҗ§гҖӮ
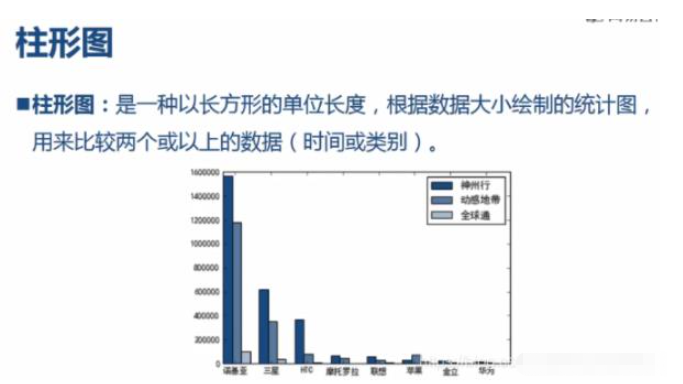
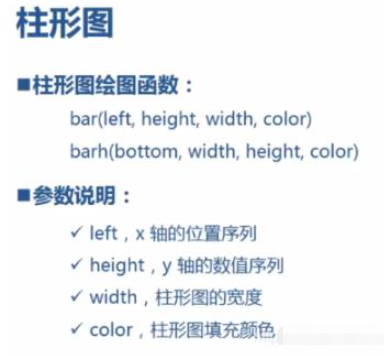
#жҹұеҪўеӣҫ
import pandas
import numpy
import matplotlib
from matplotlib import pyplot as plt
#еҜје…Ҙж•°жҚ®
data_columns=pandas.read_csv('D://Python projects//reference data//6.4//data.csv')
#е®ҡд№үдёӯж–Үж јејҸ
font={'family':'MicroSoft Yahei',
'weight':'bold',
'size':12}
matplotlib.rc('font',**font)
#дҪҝз”ЁжүӢжңәе“ҒзүҢдҪңдёәеҲҶз»„еҲ—пјҢжңҲж¶Ҳиҙ№дҪңдёәз»ҹи®ЎеҲ—
result_columns=data_columns.groupby(
by=['жүӢжңәе“ҒзүҢ'],
as_index=False)['жңҲж¶Ҳиҙ№пјҲе…ғпјү'
].agg({'жңҲжҖ»ж¶Ҳиҙ№':numpy.sum
})
#з”ҹжҲҗдёҖдёӘй—ҙйҡ”дёә1зҡ„еәҸеҲ—
index=numpy.arange(result_columns.жңҲжҖ»ж¶Ҳиҙ№.size)
#з»ҳеҲ¶зәөеҗ‘жҹұеҪўеӣҫ
plt.bar(index,result_columns['жңҲжҖ»ж¶Ҳиҙ№'])
#%matplotlib qt
plt.show()
#й…ҚзҪ®йўңиүІ
maincolor=(42/256,87/256,141/256,1)
plt.bar(index,
result_columns['жңҲжҖ»ж¶Ҳиҙ№'])
plt.show()
#й…ҚзҪ®XиҪҙж Үзӯҫ
plt.bar(index,
result_columns['жңҲжҖ»ж¶Ҳиҙ№'])
plt.xticks(index,result_columns.жүӢжңәе“ҒзүҢ)
plt.show()
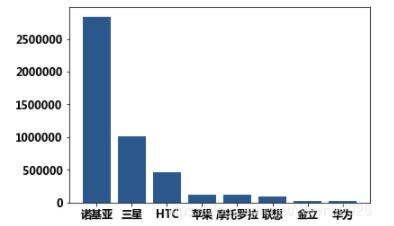
#еҜ№ж•°жҚ®иҝӣиЎҢйҷҚеәҸжҺ’еәҸеҗҺеұ•зӨә
result_asd=result_columns.sort_values(
by='жңҲжҖ»ж¶Ҳиҙ№',
ascending=False)
plt.bar(index,
result_asd.жңҲжҖ»ж¶Ҳиҙ№,
color=maincolor)
plt.xticks(index,result_asd.жүӢжңәе“ҒзүҢ)
plt.show()з»“жһңдёәпјҡ
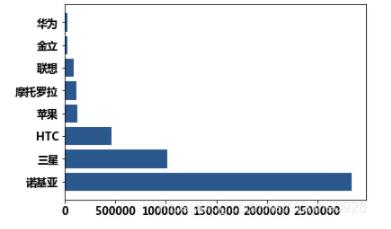
#жЁӘеҗ‘жҹұеҪўеӣҫ result_asd=result_columns.sort_values( by='жңҲжҖ»ж¶Ҳиҙ№', ascending=False) plt.barh(index, result_asd.жңҲжҖ»ж¶Ҳиҙ№, color=maincolor) plt.yticks(index,result_asd.жүӢжңәе“ҒзүҢ) plt.show()
з»“жһңдёәпјҡ
#и®Ўз®—еҮәдәӨеҸүиЎЁзҡ„ж•°жҚ® result=data_columns.pivot_table( values='жңҲж¶Ҳиҙ№пјҲе…ғпјү', index='жүӢжңәе“ҒзүҢ', columns='йҖҡдҝЎе“ҒзүҢ', aggfunc=numpy.sum)
з»“жһңдёәпјҡ
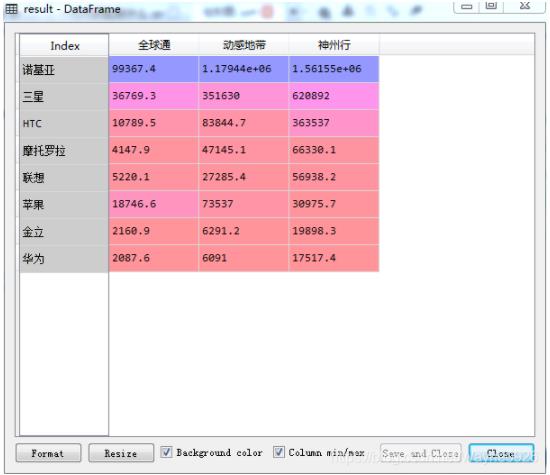
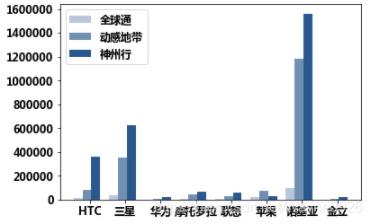
#е®ҡд№үдёүдёӘйўңиүІ index=numpy.arange(len(result)) mincolor=(42/256,87/256,141/256,1/3) midcolor=(42/256,87/256,141/256,2/3) maxcolor=(42/256,87/256,141/256,1) #е»әз«Ӣз°ҮзҠ¶жҹұеҪўеӣҫ plt.bar( index, result['е…ЁзҗғйҖҡ'], color=mincolor, width=1/4) plt.bar( index+1/4, result['еҠЁж„ҹең°еёҰ'], color=midcolor, width=1/4) plt.bar( index+1/2, result['зҘһе·һиЎҢ'], color=maxcolor, width=1/4) plt.xticks(index+1/3,result.index) #ж·»еҠ еӣҫдҫӢ plt.legend(['е…ЁзҗғйҖҡ','еҠЁж„ҹең°еёҰ','зҘһе·һиЎҢ']) plt.show()
з»“жһңдёәпјҡ
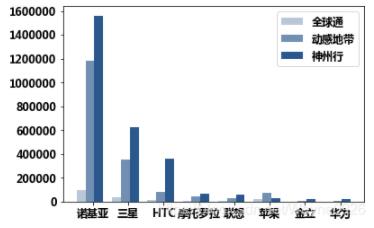
#йҮҚж–°жҺ’еәҸиҝӣиЎҢз»ҳеҲ¶ result=result.sort_values( by='зҘһе·һиЎҢ', ascending=False) plt.bar( index, result['е…ЁзҗғйҖҡ'], color=mincolor, width=1/4) plt.bar( index+1/4, result['еҠЁж„ҹең°еёҰ'], color=midcolor, width=1/4) plt.bar( index+1/2, result['зҘһе·һиЎҢ'], color=maxcolor, width=1/4) plt.xticks(index+1/3,result.index) plt.legend(['е…ЁзҗғйҖҡ','еҠЁж„ҹең°еёҰ','зҘһе·һиЎҢ']) plt.show()
з»“жһңдёәпјҡ
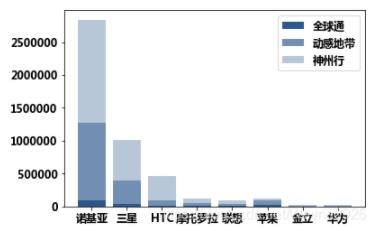
#з»ҳеҲ¶е ҶеҸ жҹұеҪўеӣҫ result=result.sort_values( by='зҘһе·һиЎҢ', ascending=False) plt.bar( index, result['е…ЁзҗғйҖҡ'], color=maxcolor) plt.bar( index, result['еҠЁж„ҹең°еёҰ'], bottom=result['е…ЁзҗғйҖҡ'], color=midcolor) plt.bar( index, result['зҘһе·һиЎҢ'], bottom=result['е…ЁзҗғйҖҡ']+result['еҠЁж„ҹең°еёҰ'], color=mincolor) plt.xticks(index,result.index) plt.legend(['е…ЁзҗғйҖҡ','еҠЁж„ҹең°еёҰ','зҘһе·һиЎҢ']) plt.show()
з»“жһңдёәпјҡ
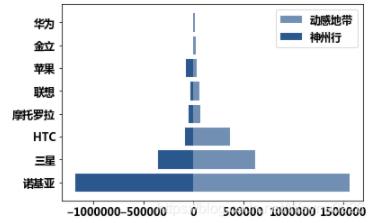
#з»ҳеҲ¶еҸҢеҗ‘жҹұеҪўеӣҫ plt.barh( index, result['зҘһе·һиЎҢ'], color=midcolor) plt.barh( index, -result['еҠЁж„ҹең°еёҰ'], color=maxcolor) plt.yticks(index, result.index) plt.legend(['еҠЁж„ҹең°еёҰ','зҘһе·һиЎҢ']) plt.show()
з»“жһңдёәпјҡ
е…ідәҺвҖңеҰӮдҪ•з”Ёpythonз»ҳеҲ¶жҹұеҪўеӣҫвҖқиҝҷзҜҮж–Үз« зҡ„еҶ…е®№е°ұд»Ӣз»ҚеҲ°иҝҷйҮҢпјҢж„ҹи°ўеҗ„дҪҚзҡ„йҳ…иҜ»пјҒзӣёдҝЎеӨ§е®¶еҜ№вҖңеҰӮдҪ•з”Ёpythonз»ҳеҲ¶жҹұеҪўеӣҫвҖқзҹҘиҜҶйғҪжңүдёҖе®ҡзҡ„дәҶи§ЈпјҢеӨ§е®¶еҰӮжһңиҝҳжғіеӯҰд№ жӣҙеӨҡзҹҘиҜҶпјҢж¬ўиҝҺе…іжіЁдәҝйҖҹдә‘иЎҢдёҡиө„и®Ҝйў‘йҒ“гҖӮ
е…ҚиҙЈеЈ°жҳҺпјҡжң¬з«ҷеҸ‘еёғзҡ„еҶ…е®№пјҲеӣҫзүҮгҖҒи§Ҷйў‘е’Ңж–Үеӯ—пјүд»ҘеҺҹеҲӣгҖҒиҪ¬иҪҪе’ҢеҲҶдә«дёәдё»пјҢж–Үз« и§ӮзӮ№дёҚд»ЈиЎЁжң¬зҪ‘з«ҷз«ӢеңәпјҢеҰӮжһңж¶үеҸҠдҫөжқғиҜ·иҒ”зі»з«ҷй•ҝйӮ®з®ұпјҡis@yisu.comиҝӣиЎҢдёҫжҠҘпјҢ并жҸҗдҫӣзӣёе…іиҜҒжҚ®пјҢдёҖз»ҸжҹҘе®һпјҢе°Ҷз«ӢеҲ»еҲ йҷӨж¶үе«ҢдҫөжқғеҶ…е®№гҖӮ