本篇内容主要讲解“怎么使用Python修改matplotlib.pyplot.colorbar的位置以对齐主图”,感兴趣的朋友不妨来看看。本文介绍的方法操作简单快捷,实用性强。下面就让小编来带大家学习“怎么使用Python修改matplotlib.pyplot.colorbar的位置以对齐主图”吧!

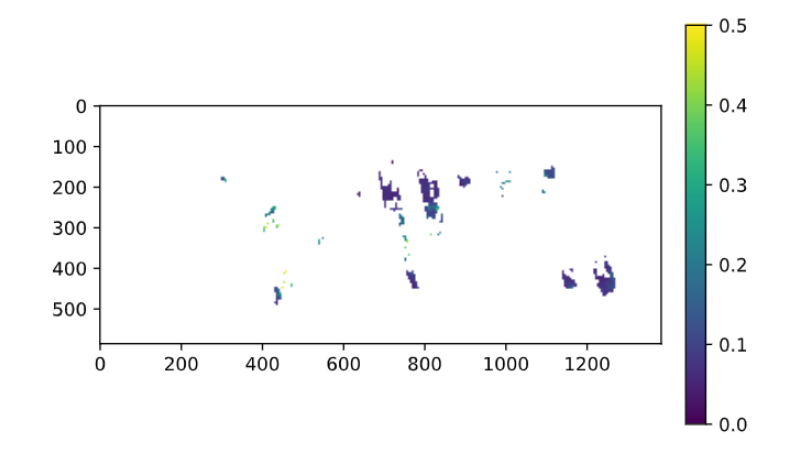
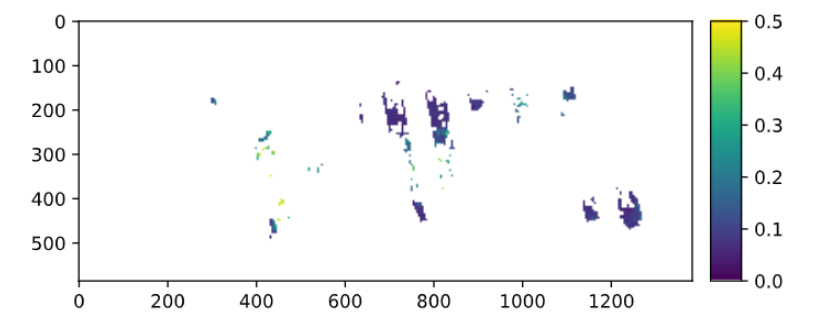
像这样的图,我想把右边的colorbar设置成和主图一样高度
fraction可以从0.035-0.046调节以找到合适大小
但当图像的长、高对比过大时,可能不起作用
这是matplotlib包里的一个函数
from mpl_toolkits.axes_grid1 import make_axes_locatable

im = plt.imshow(data)
divider = make_axes_locatable(plt.gca())
cax = divider.append_axes("right", size="5%", pad="3%")
plt.colorbar(im, cax=cax)
不适用于有投影参数的axe(会报错),如cartopy的GeoAxes
import matplotlib.pyplot as plt
from mpl_toolkits import axes_grid1

def add_colorbar(im, aspect=20, pad_fraction=0.5, **kwargs):
    """Add a vertical color bar to an image plot."""
    divider = axes_grid1.make_axes_locatable(im.axes)
    width = axes_grid1.axes_size.AxesY(im.axes, aspect=1./aspect)
    pad = axes_grid1.axes_size.Fraction(pad_fraction, width)
    current_ax = plt.gca()
    cax = divider.append_axes("right", size=width, pad=pad)
    plt.sca(current_ax)
    return im.axes.figure.colorbar(im, cax=cax, **kwargs)
用法示例
im = plt.imshow(np.arange(200).reshape((20, 10)))
add_colorbar(im)
import matplotlib.pyplot as plt
import numpy as np

fig=plt.figure()
ax = plt.axes()
im = ax.imshow(np.arange(100).reshape((10,10)))

# Create an axes for colorbar. The position of the axes is calculated based on the position of ax.
# You can change 0.01 to adjust the distance between the main image and the colorbar.
# You can change 0.02 to adjust the width of the colorbar.
# This practice is universal for both subplots and GeoAxes.

cax = fig.add_axes([ax.get_position().x1+0.01,ax.get_position().y0,0.02,ax.get_position().height])
plt.colorbar(im, cax=cax) # Similar to fig.colorbar(im, cax = cax)
效果展示

到此,相信大家对“怎么使用Python修改matplotlib.pyplot.colorbar的位置以对齐主图”有了更深的了解,不妨来实际操作一番吧!这里是亿速云网站,更多相关内容可以进入相关频道进行查询,关注我们,继续学习!
免责声明:本站发布的内容(图片、视频和文字)以原创、转载和分享为主,文章观点不代表本网站立场,如果涉及侵权请联系站长邮箱:is@yisu.com进行举报,并提供相关证据,一经查实,将立刻删除涉嫌侵权内容。