这篇“Python量化因子测算与绘图的代码怎么写”文章的知识点大部分人都不太理解,所以小编给大家总结了以下内容,内容详细,步骤清晰,具有一定的借鉴价值,希望大家阅读完这篇文章能有所收获,下面我们一起来看看这篇“Python量化因子测算与绘图的代码怎么写”文章吧。
量化因子的测算通常都是模拟交易,计算各种指标,其中:
测算需要用到的第三方库:numpy,pandas,talib
绘图需要用到的第三方库:matplotlib,seaborn
其他库随策略的需要额外添加
这里博主分享自己测算时常使用的流程,希望与大家共同进步!
测算时从因子到收益的整个流程如下:策略(因子组合) -> 买卖信号 -> 买点与卖点 -> 收益
因此我们在测算时,针对每一个个股:
首先这里是常用的一个工具导入,包括测算用的库与绘图用的库(含图片中文显示空白解决方案)
# 测算用
import numpy as np
import pandas as pd
from copy import deepcopy
from tqdm import tqdm
from datetime import datetime
import talib
# 绘图用
import matplotlib as mpl
import matplotlib.pyplot as plt
import seaborn as sns
%matplotlib inline
# 绘图现实中文
sns.set()
plt.rcParams["figure.figsize"] = (20,10)
plt.rcParams['font.sans-serif'] = ['Arial Unicode MS']  # 当前字体支持中文
plt.rcParams['axes.unicode_minus'] = False  # 解决保存图像是负号'-'显示为方块的问题
# 其他
import warnings
warnings.filterwarnings("ignore")然后是循环读取股票的代码:
import os
def readfile(path, limit=None):
    files = os.listdir(path)
    file_list = []
    for file in files:  # 遍历文件夹
        if not os.path.isdir(file):
            file_list.append(path + '/' + file)
    if limit:
        return file_list[:limit]
    return file_list
stock_dict = {}
for _file in tqdm(readfile("../data/stock_data")):
    if not _file.endswith(".pkl"):
        continue
    # TODO 这里可以添加筛选,是否需要将当前的股票添加到测算的股票池中
    file_df = pd.read_pickle(_file)
    file_df.set_index(["日期"], inplace=True)
    file_df.index.name = ""
    file_df.index = pd.to_datetime(file_df.index)
    file_df.rename(columns={'开盘':'open',"收盘":"close","最高":"high","最低":"low","成交量":"volume"},inplace=True)
    stock_code = _file.split("/")[-1].replace(".pkl", '')
    # TODO 这里可以添加日期,用来截取一部分数据
stock_dict[stock_code] = file_df上面一部分是处理股票数据,处理后的数据都会保存在 stock_dict 这个变量中,键是股票的代码,值是股票数据
测算指标时,我们以一只股票为例:
for _index,_stock_df in tqdm(stock_dict.items()):
measure_df = deepcopy(_stock_df)代码中的:
这里的measure_df即要测算的dataframe数据
使用deepcopy是防止测算的过程影响到原始数据
然后我们就可以循环这一个股票的每一行(代表每一天),测算的交易规则如下:
买入规则:买入信号发出&当前没有持仓,则买入
卖出规则:卖出信号发出&当前有持仓,则卖出
# 开始测算
trade_record_list = []
this_trade:dict = None
for _mea_i, _mea_series in measure_df.iterrows(): # 循环每一天
    if 发出买入信号:
        if this_trade is None:  # 当前没有持仓,则买入
            this_trade = {
                "buy_date": _mea_i,
                "close_record": [_mea_series['close']],
            }
    elif 发出卖出信号:
        if this_trade is not None:  # 要执行卖出
            this_trade['sell_date'] = _mea_i
            this_trade['close_record'].append(_mea_series['close'])
            trade_record_list.append(this_trade)
            this_trade = None
    else:
        if this_trade is not None:  # 当前有持仓
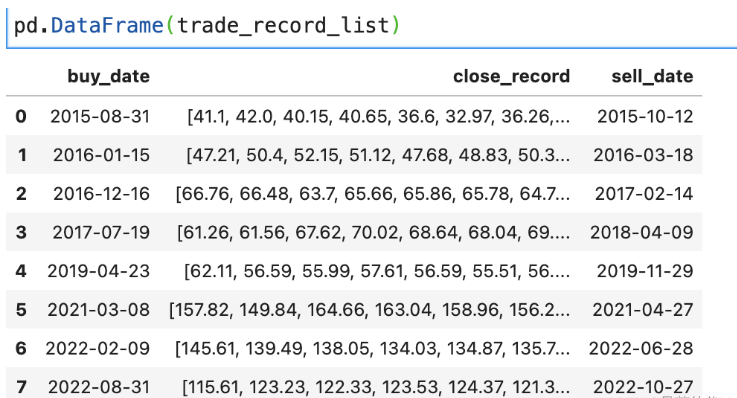
this_trade['close_record'].append(_mea_series['close'])上述代码中,我们将每一个完整的交易(买->持有->卖),都保存在了trade_record_list变量中,每一个完整的交易都会记录:
{
    'buy_date': Timestamp('2015-08-31 00:00:00'), # 买入时间
    'close_record': [41.1,42.0,40.15,40.65,36.6,32.97], # 收盘价的记录
    'sell_date': Timestamp('2015-10-12 00:00:00')} # 卖出时间
    # TODO 也可以添加自定义记录的指标
}直接使用 pd.DataFrame(trade_record_list),就可以看到总的交易结果:

整理的过程也相对简单且独立,就是循环这个交易,然后计算想要的指标,比如单次交易的年化收益可以使用:
trade_record_df = pd.DataFrame(trade_record_list)
for _,_trade_series in trade_record_df.iterrows():
    trade_record_df.loc[_i,'年化收益率'] = (_trade_series['close_record'][-1] - _trade_series['close_record'][0])/_trade_series['close_record'][0]/(_trade_series['sell_date'] - _trade_series['buy_date']).days * 365 # 年化收益
# TODO 这里根据自己想要的结果添加更多的测算指标绘图的代码通常比较固定,比如胜率图:
# 清理绘图缓存
plt.cla()
plt.clf()
# 开始绘图
plt.figure(figsize=(10, 14), dpi=100)
# 使用seaborn绘制胜率图
fig = sns.heatmap(pd.DataFrame(total_measure_record).T.round(2), annot=True, cmap="RdBu_r",center=0.5)
plt.title("胜率图")
scatter_fig = fig.get_figure()
# 保存到本地
scatter_fig.savefig("胜率图")
scatter_fig.show() # 最后显示以上就是关于“Python量化因子测算与绘图的代码怎么写”这篇文章的内容,相信大家都有了一定的了解,希望小编分享的内容对大家有帮助,若想了解更多相关的知识内容,请关注亿速云行业资讯频道。
亿速云「云服务器」,即开即用、新一代英特尔至强铂金CPU、三副本存储NVMe SSD云盘,价格低至29元/月。点击查看>>
免责声明:本站发布的内容(图片、视频和文字)以原创、转载和分享为主,文章观点不代表本网站立场,如果涉及侵权请联系站长邮箱:is@yisu.com进行举报,并提供相关证据,一经查实,将立刻删除涉嫌侵权内容。