本篇内容介绍了“怎么用Python绘制简单的折丝图”的有关知识,在实际案例的操作过程中,不少人都会遇到这样的困境,接下来就让小编带领大家学习一下如何处理这些情况吧!希望大家仔细阅读,能够学有所成!
个人前面也说了强烈建议使用Pycharm作为Python初学者的首选IDE,主要还是因为其强大的插件功能,很多环境都能一键安装完成,像本文的matplotlib,numpy,requests等。
下面直接上效果图:
import matplotlib.pyplot as plt
# 绘制折线图
squares = [1, 4, 9, 16, 25]
# plt.plot(squares, linewidth=5) # 指定折线粗细,
# #plt.show();
#
# #修改标签文字和线条粗细
# plt.title("squre number", fontsize=24)
# plt.xlabel("Value", fontsize=14)
# plt.ylabel("square of value", fontsize=14)
# plt.tick_params(axis='both', labelsize=14)
# plt.show()
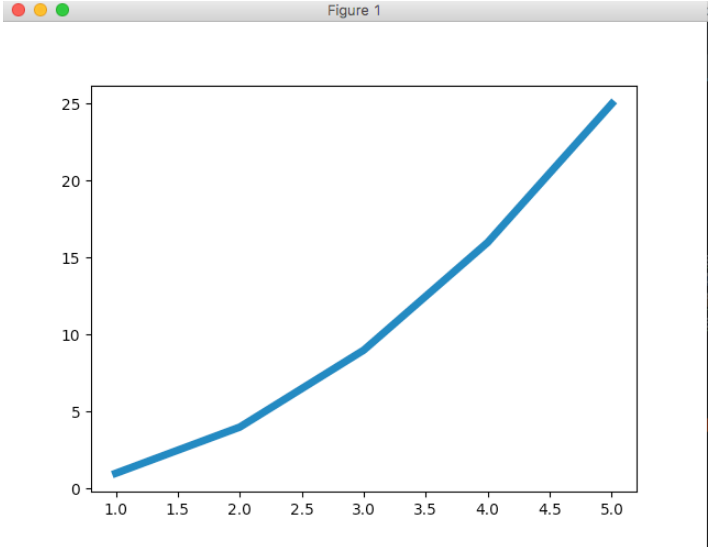
# 校正图形
input_values = [1, 2, 3, 4, 5]
plt.plot(input_values, squares, linewidth=5)
plt.show()
生成的效果图:
import matplotlib.pyplot as plt

# 简单的点
# plt.scatter(2, 4)
# plt.show()
#
# # 修改标签文字和线条粗细
plt.title("squre number", fontsize=24)
plt.xlabel("Value", fontsize=14)
plt.ylabel("square of value", fontsize=14)

#设置刻度标记大小
plt.tick_params(axis='both', which='major', labelsize=14)

# 绘制散点
x_values = [1, 2, 3, 4, 5]
y_values = [1, 4, 9, 16, 25]
plt.scatter(x_values, y_values, s=100)
plt.show()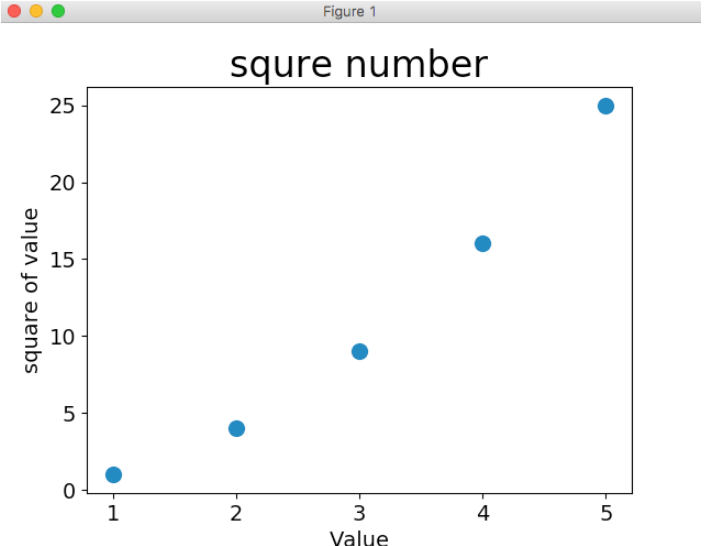
import matplotlib.pyplot as plt

x_values = list(range(1, 1001))
y_values = [x ** 2 for x in x_values]
# y_values = [x * x for x in x_values]
# y_values = [x ^ 2 for x in x_values]

plt.scatter(x_values, y_values, s=40)

# 坐标轴的取值范围
# plt.axis(0, 1100, 0, 1100000)  # 依次是xmin xmax,ymin,ymax

plt.show()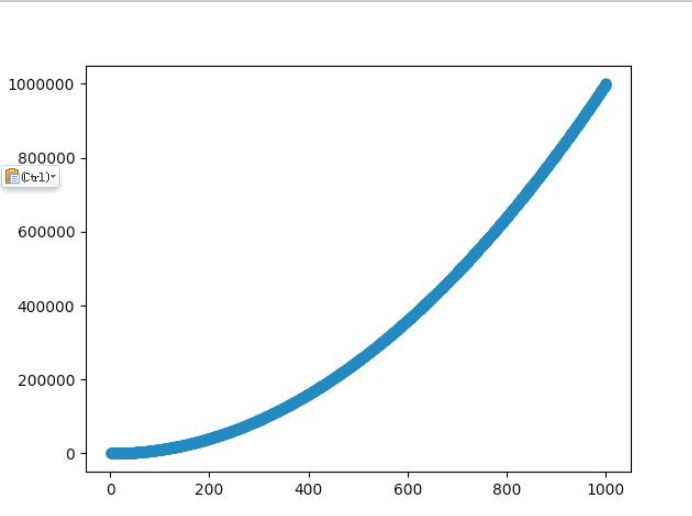
import matplotlib.pyplot as ply

from random import choice

class RandomWalk():
    def __init__(self, num_points=5000):
        self.num_points = num_points

        self.x_values = [0]
        self.y_values = [0]

    def fill_walk(self):

        # 不断走,直到达到指定步数

        while len(self.x_values) < self.num_points:

            # 决定前进方向以及沿这个方向前进的距离

            x_direction = choice([1, -1])
            x_distance = choice([0, 1, 2, 3, 4, 5, 6, 7, 8, 9])
            x_step = x_direction * x_distance

            y_direction = choice([1, -1])
            y_distance = choice([0, 1, 2, 3, 4, 5, 6, 7, 8, 9])
            y_step = y_direction * y_distance

            # 不能原地踏步

            if x_step == 0 and y_step == 0:
                continue

            next_x = self.x_values[-1] + x_step
            next_y = self.y_values[-1] + y_step

            self.x_values.append(next_x)
            self.y_values.append(next_y)

rw = RandomWalk()
rw.fill_walk()
ply.scatter(rw.x_values, rw.y_values, s=15)
ply.show()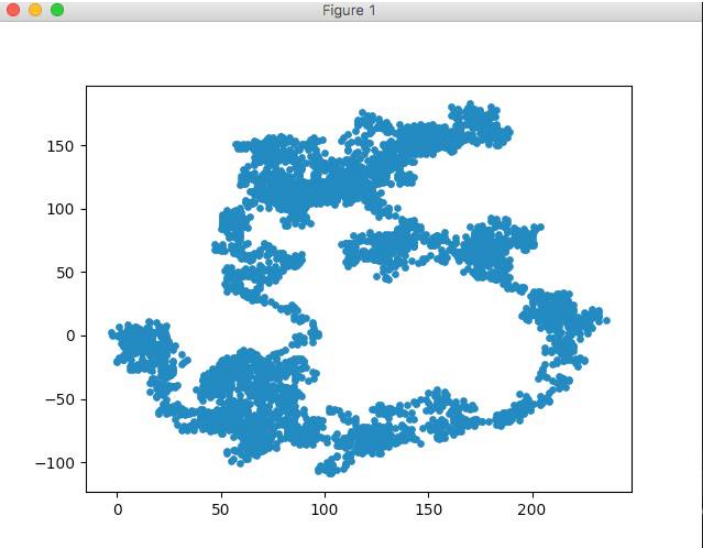
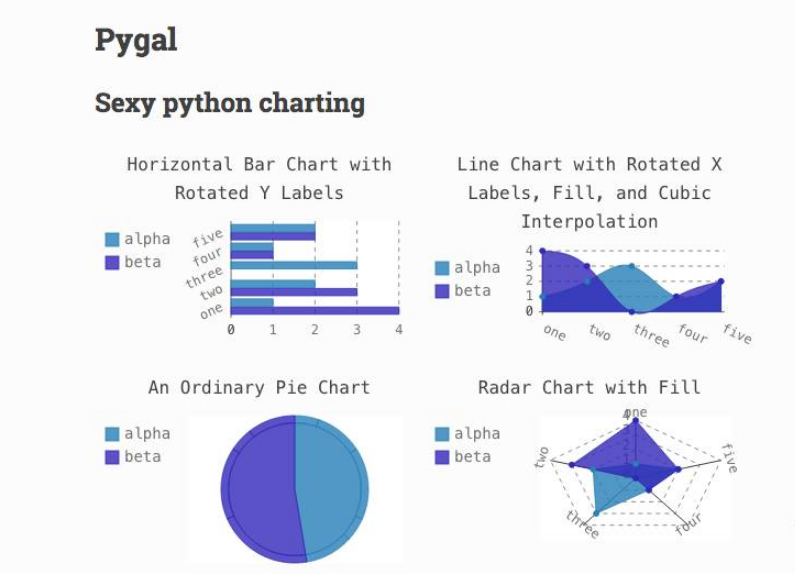
pygal能够绘制的图形可以访问pygal介绍
环境安装,直接在Pycharm上安装插件。
import pygal

from random import randint

class Die():
    def __init__(self, num_sides=6):
        self.num_sides = num_sides;

    def roll(self):
        # 返回一个位于1和骰子面数之间的随机值
        return randint(1, self.num_sides)

die = Die()
results = []

# 掷100次骰子,并将结果放在列表中。
for roll_num in range(10):
    result = die.roll()
    results.append(str(result))

print(results)

# 分析结果
frequencies = []
for value in range(1, die.num_sides + 1):
    frequency = results.count(value)
    frequencies.append(frequency)

print(frequencies)

# 对结果进行可视化
hist = pygal.Box()

hist.title = "result of rolling one D6 1000 times"
hist.x_labels = ['1', '2', '3', '4', '5', '6']
hist.x_title = "Result"
hist.y_title = "frequency of result"

hist.add('D6', frequencies)
hist.render_to_file('die_visual.svg')这个可以直接在Pycharm中安装插件,非常方便。
import requests

# 执行api调用并存储响应

url = 'https://api.github.com/search/repositories?q=language:python&sort=stars'
r = requests.get(url)
print("Status code:", r.status_code)

# 将api响应存储在一个变量中
response_dic = r.json()

# 处理结果
print(response_dic.keys())

得到结果:
Status code: 200
dict_keys(['total_count', 'incomplete_results', 'items'])# 将api响应存储在一个变量中
response_dic = r.json()
# 处理结果
print(response_dic.keys())
print("Total repositories:", response_dic['total_count'])
repo_dics = response_dic['items']
print("repositories returned:" + str(len(repo_dics)))
# 研究一个仓库
repo_dic = repo_dics[0]
print("\nKeys:", str(len(repo_dic)))
# for key in sorted(repo_dic.keys()):
# print(key)
print("Name:", repo_dic['name'])
print("Owner:", repo_dic['owner']['login'])
print("Starts:", repo_dic['stargazers_count'])
print("Repository:", repo_dic['html_url'])
print("Created:", repo_dic['created_at'])
print("Updated:", repo_dic['updated_at'])
print("Description:", repo_dic['description'])
得到结果:
Total repositories: 2061622
repositories returned:30
Keys: 71
Name: awesome-python
Owner: vinta
Starts: 40294
Repository: https://github.com/vinta/awesome-python
Created: 2014-06-27T21:00:06Z
Updated: 2017-10-29T00:50:49Z
Description: A curated list of awesome Python frameworks, libraries, software and resources“怎么用Python绘制简单的折丝图”的内容就介绍到这里了,感谢大家的阅读。如果想了解更多行业相关的知识可以关注亿速云网站,小编将为大家输出更多高质量的实用文章!
亿速云「云服务器」,即开即用、新一代英特尔至强铂金CPU、三副本存储NVMe SSD云盘,价格低至29元/月。点击查看>>
免责声明:本站发布的内容(图片、视频和文字)以原创、转载和分享为主,文章观点不代表本网站立场,如果涉及侵权请联系站长邮箱:is@yisu.com进行举报,并提供相关证据,一经查实,将立刻删除涉嫌侵权内容。
原文链接:https://my.oschina.net/u/564070/blog/4584390


 计算
计算 安全
安全 数据库
数据库 网络和加速
网络和加速 企业服务
企业服务


