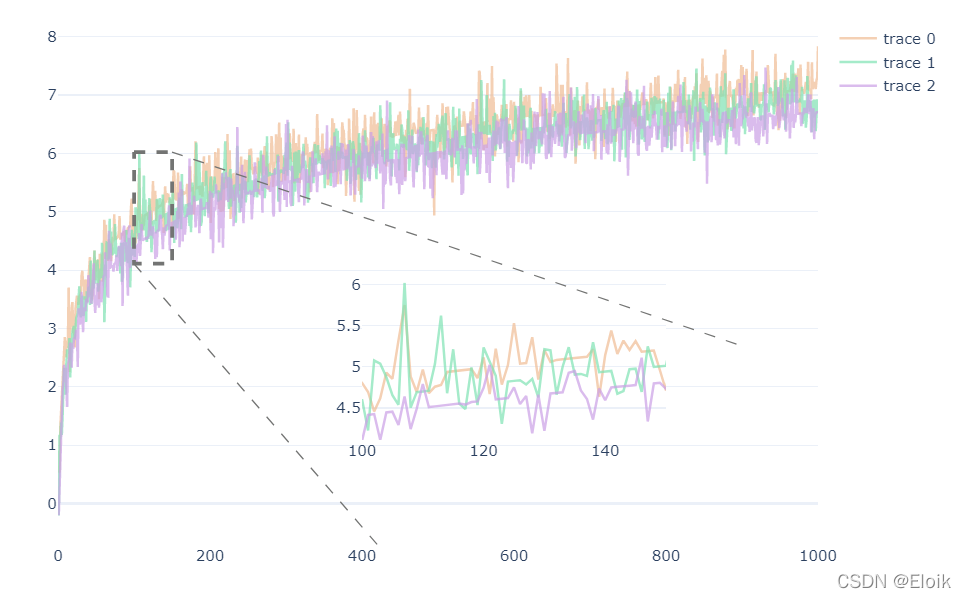
这篇文章将为大家详细讲解有关python怎么用plotly实现绘制局部放大图,小编觉得挺实用的,因此分享给大家做个参考,希望大家阅读完这篇文章后可以有所收获。

在绘图区域插入一个嵌入图,嵌入图与原图的绘画保持一致,通过限制嵌入图的x轴和y轴的显示范围,达到缩放的效果,并在原图上绘画一个矩形框,以凸显缩放的区域,最后通过两条直线凸显缩放关系。
import plotly.io as pio
import plotly.graph_objects as go
import pandas as pd
import numpy as np

# 设置plotly默认主题,白色主题
pio.templates.default = 'plotly_white'
# x坐标
x = np.arange(1, 1001)

# 生成y轴数据,并添加随机波动
y1 = np.log(x)
indexs = np.random.randint(0, 1000, 800)
for index in indexs:
    y1[index] += np.random.rand() - 0.5
y1 = y1 + 0.2

y2 = np.log(x)
indexs = np.random.randint(0, 1000, 800)
for index in indexs:
    y2[index] += np.random.rand() - 0.5

y3 = np.log(x)
indexs = np.random.randint(0, 1000, 800)
for index in indexs:
    y3[index] += np.random.rand() - 0.5
y3 = y3 - 0.2
class LocalZoomPlot:
    def __init__(self, x, y, colors, x_range, scale=0.):
        """
        :param x: x轴坐标,列表类型
        :param y: y轴坐标,二维列表类型,例如 [y1, y2, y3]
        :param colors: 每个曲线的颜色,必须与 len(y) 相等
        :param x_range: 需要缩放区域的x轴范围
        :param scale: 详见 getRangeMinMaxValue 函数
        """
        self.x = x
        self.y = y
        self.colors = colors
        self.x_range = x_range
        self.y_range = self.getRangeMinMaxValue(x_range, scale)

    def getRangeMinMaxValue(self, x_range, scale=0.):
        """
        获取指定x轴范围内,所有y数据的最大值和最小值

        :param x_range: 期望局部放大的x轴范围
        :param scale: 将最大值和最小值向两侧延伸一定距离
        """
        min_value = np.min([np.min(arr[x_range[0]:x_range[1]]) for arr in self.y])
        max_value = np.max([np.max(arr[x_range[0]:x_range[1]]) for arr in self.y])
        # 按一定比例缩放
        min_value = min_value - (max_value - min_value) * scale
        max_value = max_value + (max_value - min_value) * scale
        # 返回缩放后的结果
        return min_value, max_value

    def originPlot(self, fig, **kwargs):
        """
        根据 y 数据绘制初始折线图

        :param fig: go.Figure实例
        """
        fig.add_traces([
            go.Scatter(x=self.x, y=arr, opacity=0.7, marker_color=self.colors[i], **kwargs)
            for i, arr in enumerate(self.y)
        ])
        return fig

    def insetPlot(self, fig, inset_axes):
        """
        在原始图像上插入嵌入图

        :param fig: go.Figure对象实例
        :param inset_axes: 嵌入图的位置和大小 [左下角的x轴位置, 左下角的y轴位置, 宽度, 高度]
          所有坐标都是绝对坐标(0~1之间)
        """
        # 使用创建子图中的嵌入图参数,创建一个嵌入图
        fig = fig.set_subplots(insets=[dict(
            type='xy',
            l=inset_axes[0], b=inset_axes[1],
            w=inset_axes[2], h=inset_axes[3],
        )])
	    # 嵌入图与原始图的绘画一致,需要指定 xaxis 和 yaxis 参数确保是在嵌入图上绘画的
        fig = self.originPlot(fig, xaxis='x2', yaxis='y2', showlegend=False)
        # 将嵌入图的坐标轴范围限定在指定范围
        fig.update_layout(
            xaxis2=dict(range=self.x_range),
            yaxis2=dict(range=self.y_range)
        )
        return fig

    def rectOriginArea(self, fig):
        """
        将放大的区域框起来

        :param fig: go.Figure实例
        """
        fig.add_trace(go.Scatter(
        	# 从左上角开始,顺时针连线
            x=np.array(self.x_range)[[0, 1, 1, 0, 0]],
            y=np.array(self.y_range)[[1, 1, 0, 0, 1]],
            mode='lines',
            line={'color': '#737473', 'dash': 'dash', 'width': 3},
            showlegend=False
        ))
        return fig

    def addConnectLine(self, fig, area_point_num, point):
        """
        从放大区域指定点连线

        :param fig: go.Figure实例
        :param area_point_num: 放大区域的锚点,例如:(0, 0)表示放大区域的左下角坐标,(0, 1)表示左上角坐标,
          (1, 0)表示右下角坐标,(1, 1)表示右上角坐标,只能取这四种情况
        :param point: 要进行连线的另一个点,通常位于嵌入图附近,根据美观程度自行指定
        """
        fig.add_shape(type='line',
            x0=self.x_range[area_point_num[0]],
            y0=self.y_range[area_point_num[1]],
            x1=point[0], y1=point[1],
            line={'color': '#737473', 'dash': 'dash', 'width': 1},
        )
return figplot = LocalZoomPlot(x, [y1, y2, y3], ['#f0bc94', '#7fe2b3', '#cba0e6'], (100, 150), 0.) fig = go.Figure() fig = plot.originPlot(fig) fig = plot.insetPlot(fig, (0.4, 0.2, 0.4, 0.3)) fig = plot.rectOriginArea(fig) fig = plot.addConnectLine(fig, (0, 0), (420, -0.7)) fig = plot.addConnectLine(fig, (1, 1), (900, 2.7)) # 额外对图片进行设置 fig.update_layout( width=800, height=600, xaxis=dict( rangemode='tozero', showgrid=False, zeroline=False, ), xaxis2=dict( showgrid=False, zeroline=False ), ) fig.show()
关于“python怎么用plotly实现绘制局部放大图”这篇文章就分享到这里了,希望以上内容可以对大家有一定的帮助,使各位可以学到更多知识,如果觉得文章不错,请把它分享出去让更多的人看到。
免责声明:本站发布的内容(图片、视频和文字)以原创、转载和分享为主,文章观点不代表本网站立场,如果涉及侵权请联系站长邮箱:is@yisu.com进行举报,并提供相关证据,一经查实,将立刻删除涉嫌侵权内容。