R语言可视化中多系列柱形图与分面组图美化技巧有哪些,很多新手对此不是很清楚,为了帮助大家解决这个难题,下面小编将为大家详细讲解,有这方面需求的人可以来学习下,希望你能有所收获。
今天跟大家分享多系列与分面组图的美化技巧!
昨天讲的关于多序列柱形图与条形图美化技巧,其实还漏掉了一些一点儿。
当数据序列比较多的时候,特别是超过四个以后,还用堆积柱形图(条形图)、或者簇状柱形图的话,图表必然会因为系列太多而受到挤压或者变形,整体就会不协调、不美观。
还有ggplot不支持次坐标轴功能,它的作图思维基本源于塔夫脱的可视化理念,而且作者个人的审美也接受次坐标轴(大牛任性),但是他留给大家解决多序列图表的方案是——分面组图~
data<-data.frame(Name = c("苹果","谷歌","脸书","亚马逊","腾讯"),Conpany = c("Apple","Google","Facebook","Amozon","Tencent"),Sale2013 = c(5000,3500,2300,2100,3100),Sale2014 = c(5050,3800,2900,2500,3300),Sale2015 = c(5050,3800,2900,2500,3300),Sale2016 = c(5050,3800,2900,2500,3300))

数据重塑(宽转长):
mydata<-melt(mydata,id.vars="Conpany",variable.name="Year",value.name="Sale")
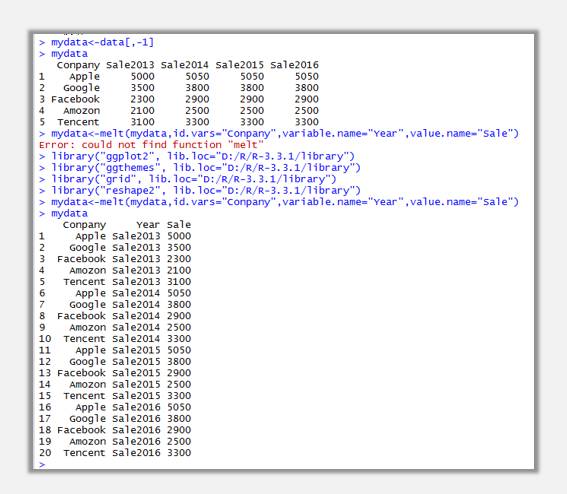
作图函数:
ggplot(mydata,aes(Conpany,Sale,fill=Year))+geom_bar(stat="identity",position="dodge")
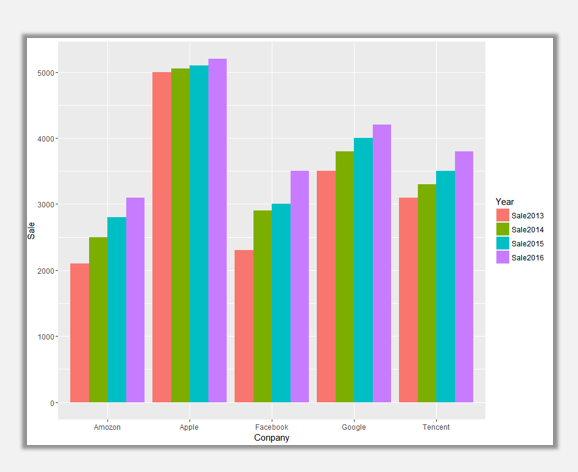
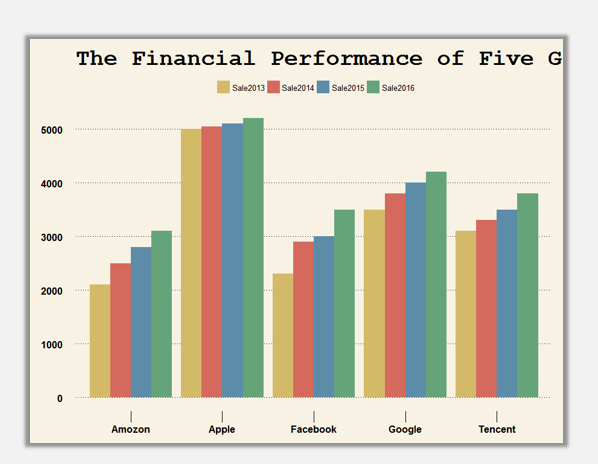
默认图表的配色确实挺难看的,这里我们使用华尔街日报、经济学人的主题、及配色模板。
ggplot(mydata,aes(Conpany,Sale,fill=Year))+geom_bar(stat="identity",position="dodge")+theme_wsj()+scale_fill_wsj("rgby", "")+theme(axis.ticks.length=unit(0.5,'cm'))+guides(fill=guide_legend(title=NULL))+ggtitle("The Financial Performance of Five Giant")+theme(axis.title = element_blank())
ggplot(mydata,aes(Conpany,Sale,fill=Year))+geom_bar(stat="identity",position="dodge")+theme_economist(base_size=14)+scale_fill_economist()+theme(axis.ticks.length=unit(0.5,'cm'))+guides(fill=guide_legend(title=NULL))+ggtitle("The Financial Performance of Five Giant")+theme(axis.title = element_blank())
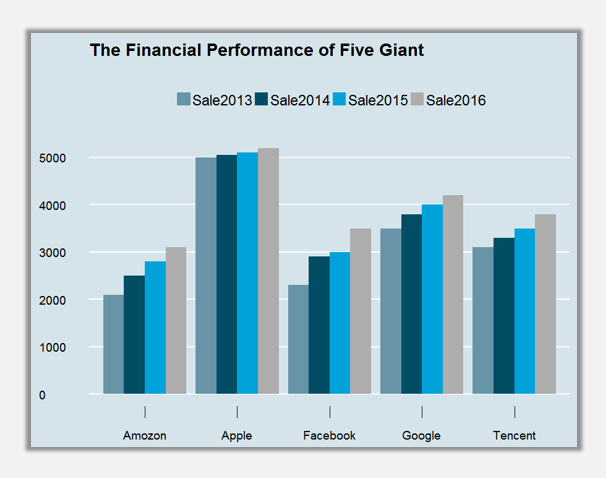
以上是我们使用传统的方法通过将颜色映射到不同类别的年度收入变量上,达到了区分效果,可是这样终究不是办法,五个序列实在是有点多,已经让然有点儿眼花缭乱了,如果有8个序列、10个序列呢,那又该怎么办呢~
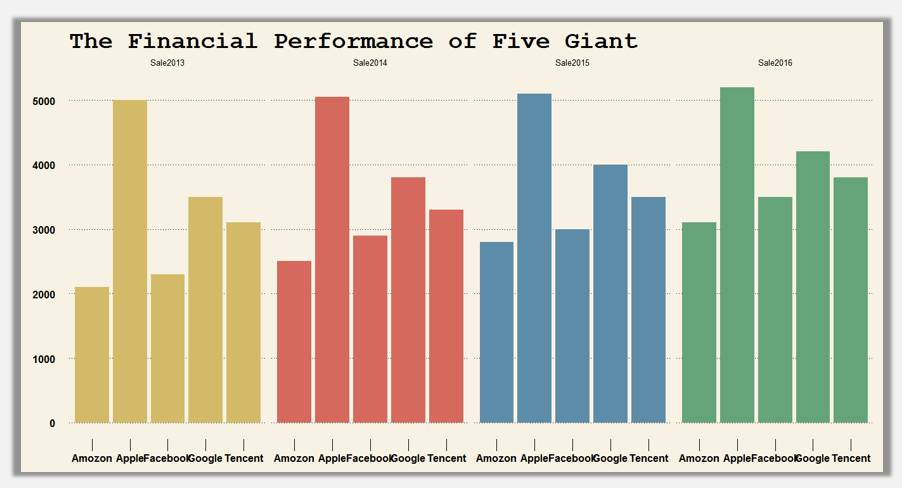
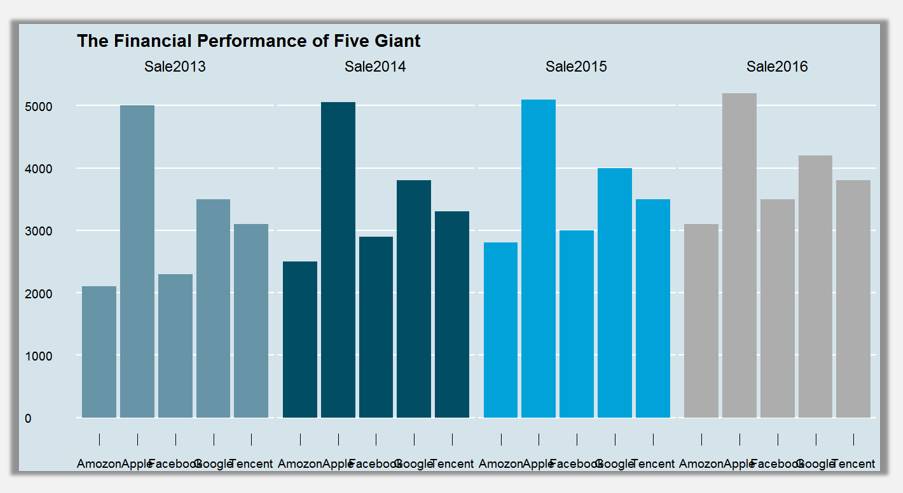
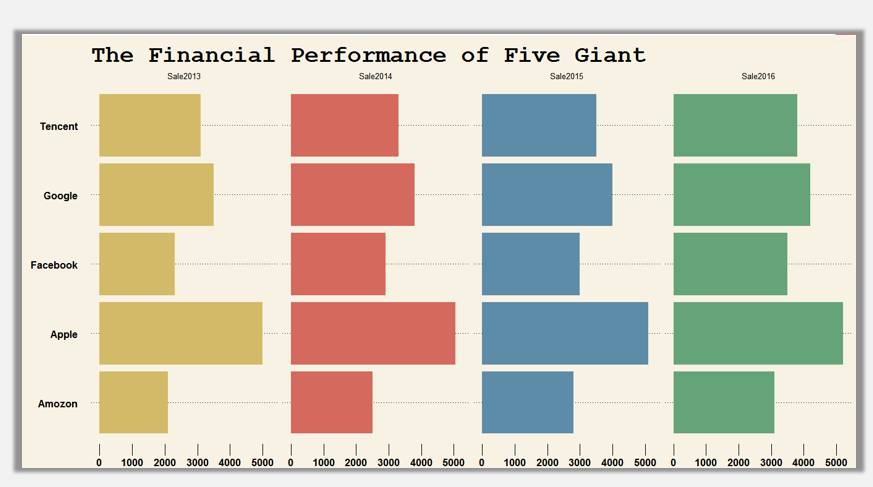
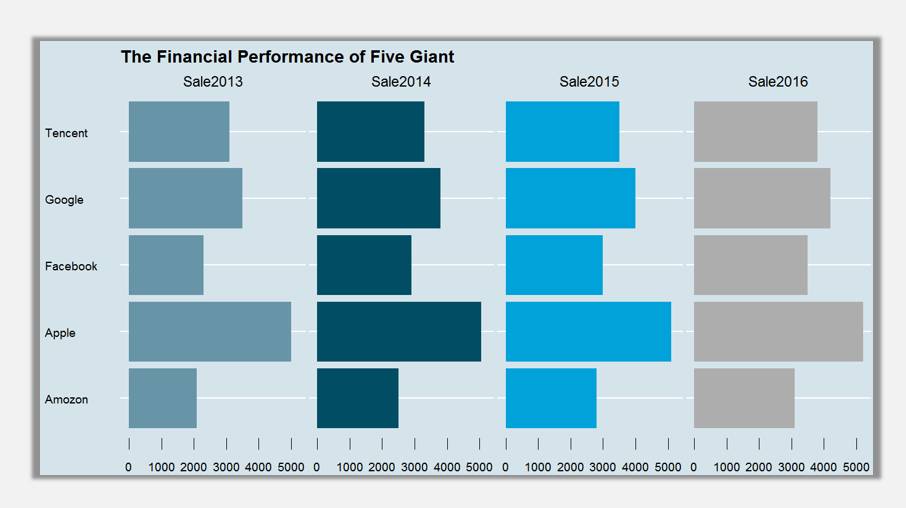
下面跟大家将其中一种比较有效的解决办法:通过分面组图解决多序列图表:
横排分面:
柱形分面(横排):
ggplot(mydata,aes(Conpany,Sale,fill=Year))+geom_bar(stat="identity",position="dodge")+theme_wsj()+scale_fill_wsj("rgby", "")+theme(axis.ticks.length=unit(0.5,'cm'))+guides(fill=guide_legend(title=NULL))+ggtitle("The Financial Performance of Five Giant")+theme(axis.title = element_blank(),legend.position='none')+ facet_grid(.~Year)
ggplot(mydata,aes(Conpany,Sale,fill=Year))+geom_bar(stat="identity",position="dodge")+theme_economist(base_size=14)+scale_fill_economist()+theme(axis.ticks.length=unit(0.5,'cm'))+guides(fill=guide_legend(title=NULL))+ggtitle("The Financial Performance of Five Giant")+theme(axis.title = element_blank(),legend.position='none')+ facet_grid(.~Year)
条形分面(横排):
ggplot(mydata,aes(Conpany,Sale,fill=Year))+geom_bar(stat="identity",position="dodge")+theme_wsj()+scale_fill_wsj("rgby", "")+theme(axis.ticks.length=unit(0.5,'cm'))+guides(fill=guide_legend(title=NULL))+ggtitle("The Financial Performance of Five Giant")+theme(axis.title = element_blank(),legend.position='none')+ facet_grid(.~Year)+coord_flip()
ggplot(mydata,aes(Conpany,Sale,fill=Year))+geom_bar(stat="identity",position="dodge")+theme_economist(base_size=14)+scale_fill_economist()+theme(axis.ticks.length=unit(0.5,'cm'))+guides(fill=guide_legend(title=NULL))+ggtitle("The Financial Performance of Five Giant")+theme(axis.title = element_blank(),legend.position='none')+ facet_grid(.~Year)+coord_flip()
竖排分面:
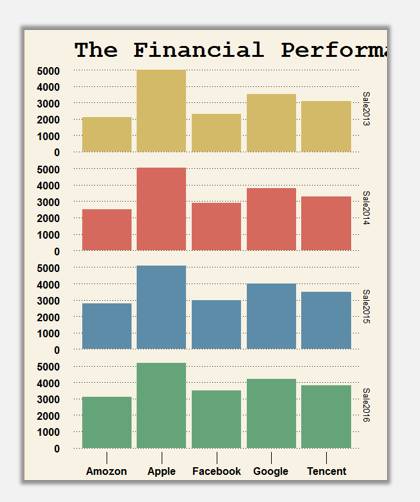
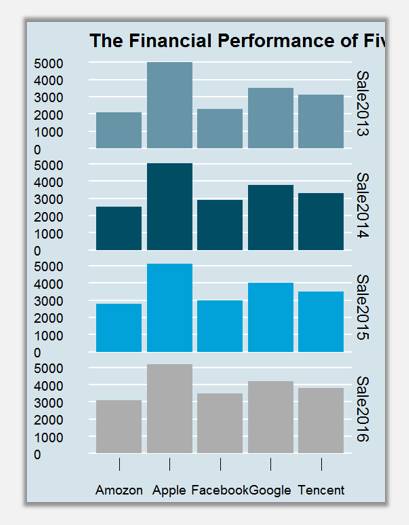
柱形分面(竖排):
ggplot(mydata,aes(Conpany,Sale,fill=Year))+geom_bar(stat="identity",position="dodge")+theme_wsj()+scale_fill_wsj("rgby", "")+theme(axis.ticks.length=unit(0.5,'cm'))+guides(fill=guide_legend(title=NULL))+ggtitle("The Financial Performance of Five Giant")+theme(axis.title = element_blank(),legend.position='none')+ facet_grid(Year~.)
ggplot(mydata,aes(Conpany,Sale,fill=Year))+geom_bar(stat="identity",position="dodge")+theme_economist(base_size=14)+scale_fill_economist()+theme(axis.ticks.length=unit(0.5,'cm'))+guides(fill=guide_legend(title=NULL))+ggtitle("The Financial Performance of Five Giant")+theme(axis.title = element_blank(),legend.position='none')+ facet_grid(Year~.)
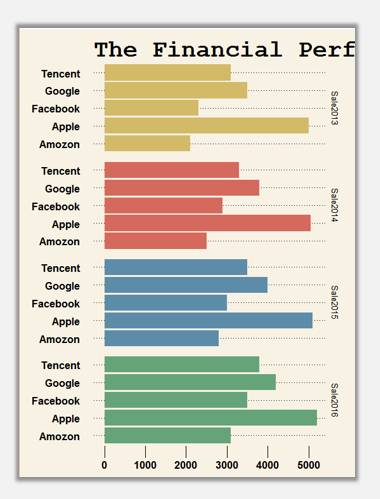
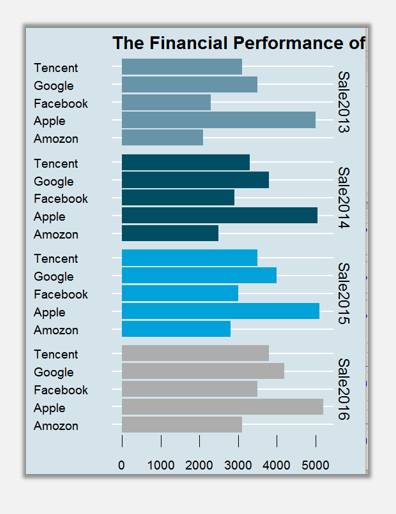
条形分面(竖排):
ggplot(mydata,aes(Conpany,Sale,fill=Year))+geom_bar(stat="identity",position="dodge")+theme_wsj()+scale_fill_wsj("rgby", "")+theme(axis.ticks.length=unit(0.5,'cm'))+guides(fill=guide_legend(title=NULL))+ggtitle("The Financial Performance of Five Giant")+theme(axis.title = element_blank(),legend.position='none')+ facet_grid(Year~.)+coord_flip()
ggplot(mydata,aes(Conpany,Sale,fill=Year))+geom_bar(stat="identity",position="dodge")+theme_economist(base_size=14)+scale_fill_economist()+theme(axis.ticks.length=unit(0.5,'cm'))+guides(fill=guide_legend(title=NULL))+ggtitle("The Financial Performance of Five Giant")+theme(axis.title = element_blank(),legend.position='none')+ facet_grid(Year~.)+coord_flip()
关于簇状、分面图表数据标签问题:
昨天在讲解的时候忘记了图表数据标签这回事儿,而且当时确实也不太会处理这块儿,后来突然找到了处理方法:
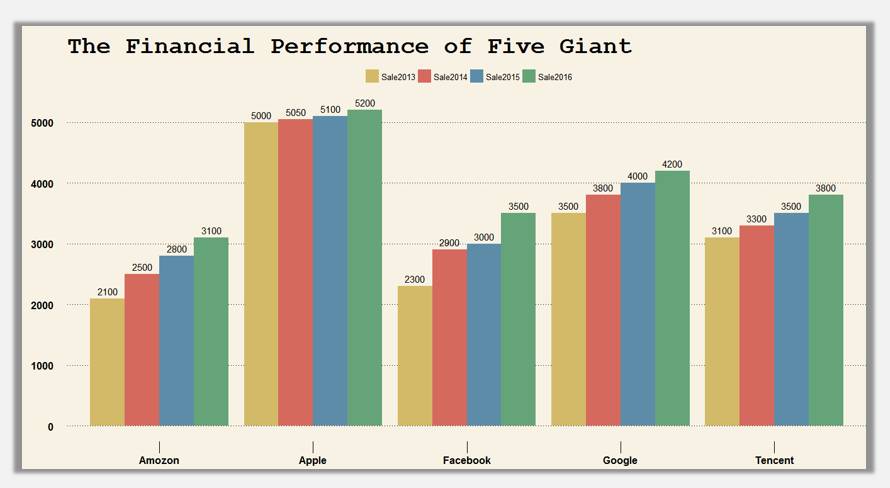
簇状图标签数据处理:
ggplot(mydata,aes(Conpany,Sale,fill=Year,label =Sale))+geom_bar(stat="identity",position="dodge")+theme_wsj()+scale_fill_wsj("rgby", "")+theme(axis.ticks.length=unit(0.5,'cm'))+guides(fill=guide_legend(title=NULL))+ggtitle("The Financial Performance of Five Giant")+theme(axis.title = element_blank())+geom_text(aes(y = Sale + 0.05), position = position_dodge(0.9), vjust = -0.5)
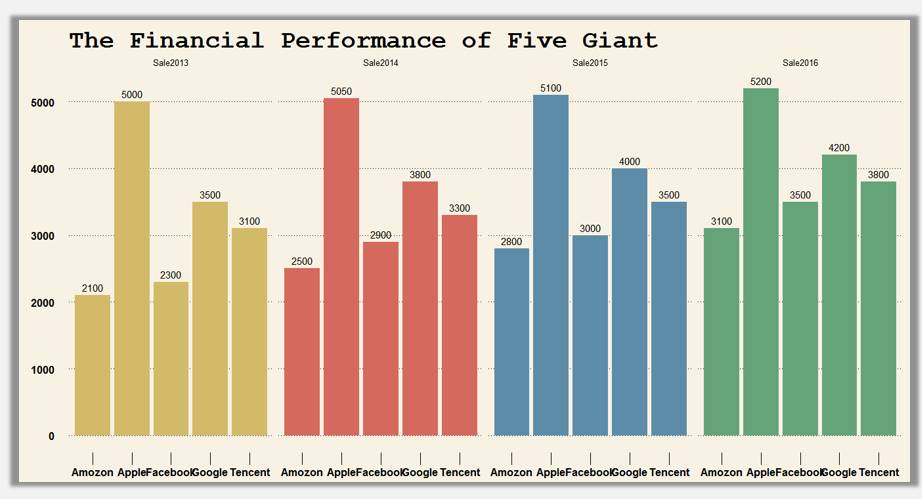
横向分面柱图数据标签问题:
ggplot(mydata,aes(Conpany,Sale,fill=Year,label =Sale))+geom_bar(stat="identity",position="dodge")+theme_wsj()+scale_fill_wsj("rgby", "")+theme(axis.ticks.length=unit(0.5,'cm'))+guides(fill=guide_legend(title=NULL))+ggtitle("The Financial Performance of Five Giant")+theme(axis.title = element_blank(),legend.position='none')+ facet_grid(.~Year)+geom_text(aes(y = Sale + 0.05), position = position_dodge(0.9), vjust = -0.5)
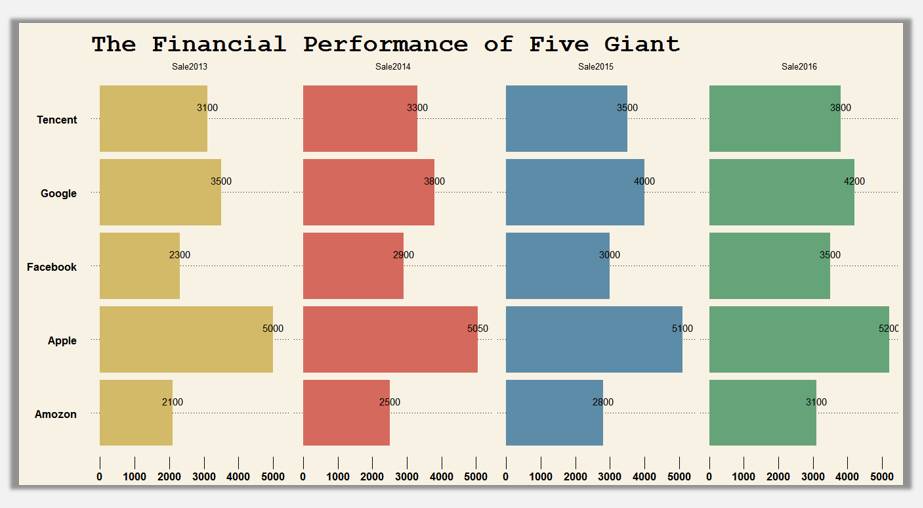
横向分面条形图数据标签问题:
ggplot(mydata,aes(Conpany,Sale,fill=Year,label =Sale))+geom_bar(stat="identity",position="dodge")+theme_wsj()+scale_fill_wsj("rgby", "")+theme(axis.ticks.length=unit(0.5,'cm'))+guides(fill=guide_legend(title=NULL))+ggtitle("The Financial Performance of Five Giant")+theme(axis.title = element_blank(),legend.position='none')+ facet_grid(.~Year)+geom_text(aes(y = Sale + 0.05), position = position_dodge(0.9), vjust = -0.5)+coord_flip()
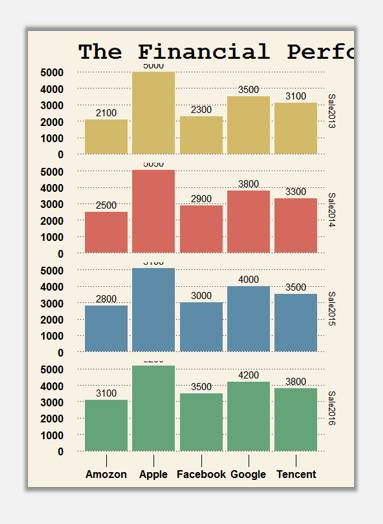
竖向分面柱形图数据标签问题:
ggplot(mydata,aes(Conpany,Sale,fill=Year,label =Sale))+geom_bar(stat="identity",position="dodge")+theme_wsj()+scale_fill_wsj("rgby", "")+theme(axis.ticks.length=unit(0.5,'cm'))+guides(fill=guide_legend(title=NULL))+ggtitle("The Financial Performance of Five Giant")+theme(axis.title = element_blank(),legend.position='none')+ facet_grid(Year~.)+geom_text(aes(y = Sale + 0.05), position = position_dodge(0.9), vjust = -0.5)
竖向分面条形图数据标签问题:
ggplot(mydata,aes(Conpany,Sale,fill=Year,label =Sale))+geom_bar(stat="identity",position="dodge")+theme_wsj()+scale_fill_wsj("rgby", "")+theme(axis.ticks.length=unit(0.5,'cm'))+guides(fill=guide_legend(title=NULL))+ggtitle("The Financial Performance of Five Giant")+theme(axis.title = element_blank(),legend.position='none')+ facet_grid(Year~.)+geom_text(aes(y = Sale + 0.05), position = position_dodge(0.9), vjust = -0.5)+coord_flip()
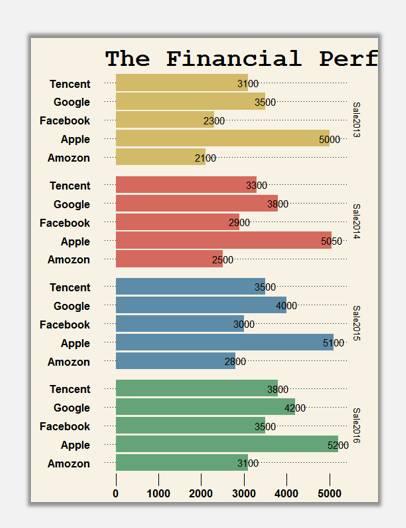
好了,这样分面组图及其标签问题算是列举清楚了。
看完上述内容是否对您有帮助呢?如果还想对相关知识有进一步的了解或阅读更多相关文章,请关注亿速云行业资讯频道,感谢您对亿速云的支持。
亿速云「云服务器」,即开即用、新一代英特尔至强铂金CPU、三副本存储NVMe SSD云盘,价格低至29元/月。点击查看>>
免责声明:本站发布的内容(图片、视频和文字)以原创、转载和分享为主,文章观点不代表本网站立场,如果涉及侵权请联系站长邮箱:is@yisu.com进行举报,并提供相关证据,一经查实,将立刻删除涉嫌侵权内容。
原文链接:https://my.oschina.net/u/3335309/blog/4575523