这篇文章主要介绍了Python编程如何使用matplotlib绘制动态圆锥曲线,具有一定借鉴价值,感兴趣的朋友可以参考下,希望大家阅读完这篇文章之后大有收获,下面让小编带着大家一起了解一下。
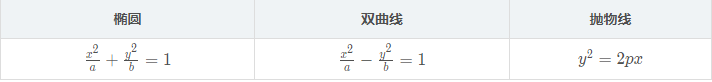
作为让高中生心脏骤停的四个字,对于高考之后的人来说可谓刻骨铭心,所以定义不再赘述,直接撸图,其标准方程分别为
在Python中,绘制动图需要用到matplotlib中的animation包,其调用方法以及接下来要用到的参数为
ani = animation.FuncAnimation(fig, func, frames, interval)
其中fig为绘图窗口,func为绘图函数,其返回值为图像,frames为迭代参数,如果为整型的话,其迭代参数则为range(frames)。
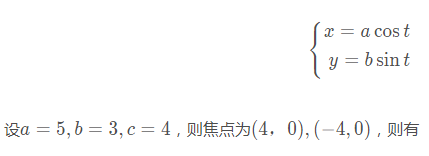
为了绘图方便,椭圆的参数方程为
代码为:
# 这三个包在后面的程序中不再复述
import numpy as np
import matplotlib.pyplot as plt
import matplotlib.animation as animation
a,b,c = 5,3,4
fig = plt.figure(figsize=(12,9))
ax = fig.add_subplot(autoscale_on=False,
    xlim=(-a,a),ylim=(-b,b))
ax.grid()
line, = ax.plot([],[],'o-',lw=2)
trace, = ax.plot([],[],'-', lw=1)
theta_text = ax.text(0.02,0.85,'',transform=ax.transAxes)
textTemplate = '''theta = %.1f°\n
lenL = %.1f, lenR = %.1f\n
lenL+lenR = %.1f'''
xs,ys = [], []
def animate(i):
    if(i==0):
        xs.clear()
        ys.clear()
    theta = i*0.04
    x = a*np.cos(theta)
    y = b*np.sin(theta)
    xs.append(x)
    ys.append(y)
    line.set_data([-c,x,c], [0,y,0])
    trace.set_data(xs,ys)
    lenL = np.sqrt((x+c)**2+y**2)
    lenR = np.sqrt((x-c)**2+y**2)
    theta_text.set_text(textTemplate %
        (180*theta/np.pi, lenL, lenR, lenL+lenR))
    return line, trace, theta_text
ani = animation.FuncAnimation(fig, animate, 157,
    interval=5, blit=True)
ani.save("ellipse.gif")
plt.show()双曲线的参数方程为
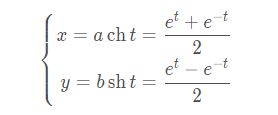
设 a = 4 , b = 3 , c = 5 则代码如下
a,b,c = 4,3,5
fig = plt.figure(figsize=(12,9))
ax = fig.add_subplot(autoscale_on=False,
    xlim=(-c,16),ylim=(-12,12))
ax.grid()
line, = ax.plot([],[],'o-',lw=2)
trace, = ax.plot([],[],'-', lw=1)
theta_text = ax.text(0.01,0.85,'',
    transform=ax.transAxes)
textTemplate = '''t = %.1f\n
lenL = %.1f, lenR = %.1f\n
lenL-lenR = %.1f'''
xs,ys = [],[]
def animate(t):
    if(t==-3):
        xs.clear()
        ys.clear()
    x = a*np.cosh(t)
    y = b*np.sinh(t)
    xs.append(x)
    ys.append(y)
    line.set_data([-c,x,c], [0,y,0])
    trace.set_data(xs,ys)
    lenL = np.sqrt((x+c)**2+y**2)
    lenR = np.sqrt((x-c)**2+y**2)
    theta_text.set_text(textTemplate %
        (t, lenL, lenL, lenL-lenR))
    return line, trace, theta_text
frames = np.arange(-3,3,0.05)
ani = animation.FuncAnimation(fig, animate,
    frames, interval=5, blit=True)
ani.save("hyperbola.gif")

plt.show()

import numpy as np
import matplotlib.pyplot as plt
import matplotlib.animation as animation
a,b,c = 4,3,5
p = 1
fig = plt.figure(figsize=(12,9))
ax = fig.add_subplot(autoscale_on=False,
    xlim=(-0.6,4.5),ylim=(-3,3))
ax.grid()
ax.plot([-p/2,-p/2],[-5,5],'-',lw=2)
line, = ax.plot([],[],'o-',lw=2)
trace, = ax.plot([],[],'-', lw=1)
theta_text = ax.text(0.05,0.85,'',
    transform=ax.transAxes)
textTemplate = '''y = %.1f\n
lenL = %.1f, lenF = %.1f\n
lenL-lenF = %.1f'''
xs,ys = [],[]
def animate(y):
    if(y==-3):
        xs.clear()
        ys.clear()
    x = y**2/p/2
    xs.append(x)
    ys.append(y)
    line.set_data([-p,x,p/2], [y,y,0])
    trace.set_data(xs,ys)
    lenL = x+p/2
    lenF = np.sqrt((x-p/2)**2+y**2)
    theta_text.set_text(textTemplate %
        (y, lenL, lenF, lenL-lenF))
    return line, trace, theta_text
frames = np.arange(-3,3,0.1)
ani = animation.FuncAnimation(fig, animate,
    frames, interval=5, blit=True)
ani.save("parabola.gif")
plt.show()
圆锥曲线在极坐标系下有相同的表达式,即
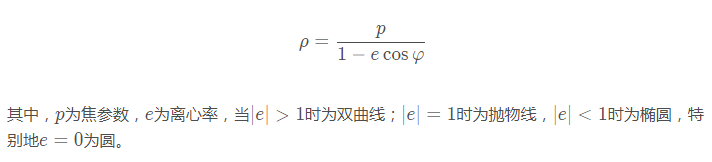
在matplotlib中,极坐标图像需要通过projection='polar'来标识,其代码为
p = 2
fig = plt.figure(figsize=(12,9))
ax = fig.add_subplot(autoscale_on=False, projection='polar')
ax.set_rlim(0,8)
trace, = ax.plot([],[],'-', lw=1)
theta_text = ax.text(0.05,0.95,'',transform=ax.transAxes)
textTemplate = 'e = %.1f\n'
theta = np.arange(-3.1,3.2,0.1)
def animate(e):
    rho = p/(1-e*np.cos(theta))
    trace.set_data(theta,rho)
    theta_text.set_text(textTemplate % e)
    return trace, theta_text
frames = np.arange(-2,2,0.1)
ani = animation.FuncAnimation(fig, animate,
    frames, interval=100, blit=True)
ani.save("polar.gif")
plt.show()
感谢你能够认真阅读完这篇文章,希望小编分享的“Python编程如何使用matplotlib绘制动态圆锥曲线”这篇文章对大家有帮助,同时也希望大家多多支持亿速云,关注亿速云行业资讯频道,更多相关知识等着你来学习!
免责声明:本站发布的内容(图片、视频和文字)以原创、转载和分享为主,文章观点不代表本网站立场,如果涉及侵权请联系站长邮箱:is@yisu.com进行举报,并提供相关证据,一经查实,将立刻删除涉嫌侵权内容。


