本篇内容介绍了“uniapp如何引用echarts画柱状图”的有关知识,在实际案例的操作过程中,不少人都会遇到这样的困境,接下来就让小编带领大家学习一下如何处理这些情况吧!希望大家仔细阅读,能够学有所成!
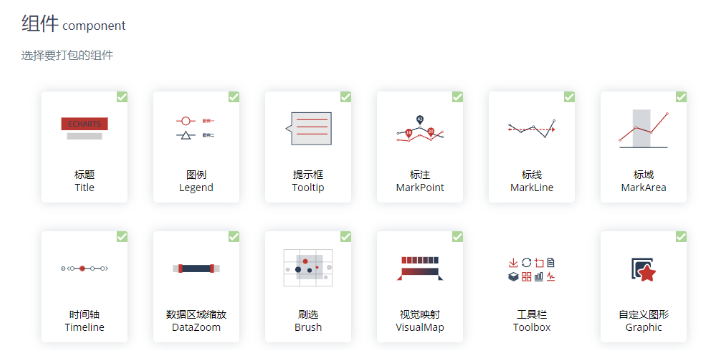
选择柱状图,折线图,饼图;这三样是平常较常用到的
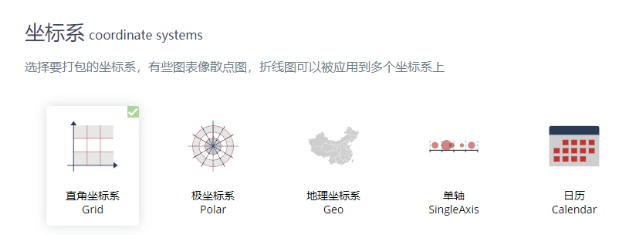
坐标系选择直角坐标系;
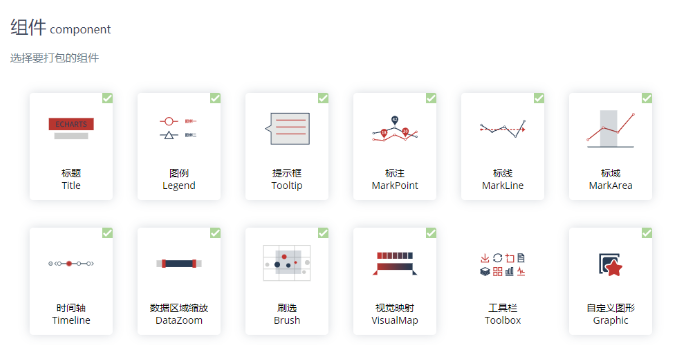
组件可以全选,也可以选择自己所需要的,在这里个人建议除了工具栏不选,其他都选上;下载后的文件为echarts.min.js,建议把他放在static内。
好了,来到下一步,我们需要在components内创建一个echarts.vue,把这段代码复制下来,放到echarts.vue内;
<template>
	<view>
		<view class="echarts" :prop="option" :change:prop="echarts.update"></view>
	</view>
</template>

<script>
	export default {
		name: 'Echarts',
		props: {
			option: {
				type: Object,
				required: true
			}
		}
	}
</script>

<script module="echarts" lang="renderjs">
	export default {
		data() {
			return {
				chart: null
			}
		},
		mounted() {
			if (typeof window.echarts === 'object') {
				this.init()
			} else {
				// 动态引入类库
				const script = document.createElement('script')
				script.src = './static/echarts.min.js'
				// script.src = './static/echarts/echarts.min.js'
				script.onload = this.init
				document.head.appendChild(script)
			}
		},
		methods: {
			/**
			 * 初始化echarts
			 */
			init() {
				this.chart = echarts.init(this.$el)
				this.update(this.option)
			},
			/**
			 * 监测数据更新
			 * @param {Object} option
			 */
			update(option) {
				if (this.chart) {
					// 因App端,回调函数无法从renderjs外传递,故在此自定义设置相关回调函数
					if (option) {
						// tooltip
						if (option.tooltip) {
							// 判断是否设置tooltip的位置
							if (option.tooltip.positionStatus) {
								option.tooltip.position = this.tooltipPosition()
							}
							// 判断是否格式化tooltip
							if (option.tooltip.formatterStatus) {
								option.tooltip.formatter = this.tooltipFormatter(option.tooltip.formatterUnit, option
									.tooltip.formatFloat2, option.tooltip.formatThousands)
							}
						}
						// if (option.xAxis[0].data.length >= 5) {
						// 	option.xAxis[0].axisLabel.formatter = function formatter(params) {
						// 		if (params > 5) {
						// 			return params;
						// 		}
						// 		var maxLength = 4;
						// 		//判断长度,超出使用...代替
						// 		if (params && params.length > maxLength) {
						// 			return params.substring(0, maxLength - 1) + '...';
						// 		} else {
						// 			return params;
						// 		}
						// 	}
						// } else if(option.xAxis[0].data.length === 1){
						// 	option.xAxis[0].axisLabel.formatter = function formatter(params) {
						// 		return params
						// 	}
						// } else {
						// 	option.xAxis[0].axisLabel.formatter = function formatter(params) {
						// 		if (params > 5) {
						// 			return params;
						// 		}
						// 		var maxLength = 6;
						// 		//判断长度,超出使用...代替
						// 		if (params && params.length > maxLength) {
						// 			return params.substring(0, maxLength - 1) + '...';
						// 		} else {
						// 			return params;
						// 		}
						// 	}
						// }
						// 设置新的option
						this.chart.setOption(option, option.notMerge)
					}

				}
			},
			/**
			 * 设置tooltip的位置,防止超出画布
			 */
			tooltipPosition() {
				return (point, params, dom, rect, size) => {
					//其中point为当前鼠标的位置,size中有两个属性:viewSize和contentSize,分别为外层div和tooltip提示框的大小
					let x = point[0]
					let y = point[1]
					let viewWidth = size.viewSize[0]
					let viewHeight = size.viewSize[1]
					let boxWidth = size.contentSize[0]
					let boxHeight = size.contentSize[1]
					let posX = 0 //x坐标位置
					let posY = 0 //y坐标位置
					if (x < boxWidth) { //左边放不开
						posX = 5
					} else { //左边放的下
						posX = x - boxWidth
					}
					if (y < boxHeight) { //上边放不开
						posY = 5
					} else { //上边放得下
						posY = y - boxHeight
					}
					return [posX, posY]
				}
			},
			/**
			 * tooltip格式化
			 * @param {Object} unit 数值后的单位
			 * @param {Object} formatFloat2 是否保留两位小数
			 * @param {Object} formatThousands 是否添加千分位
			 */
			tooltipFormatter(unit, formatFloat2, formatThousands) {
				return params => {
					let result = ''
					unit = unit ? unit : ''
					for (let i in params) {
						if (i == 0) {
							result += params[i].axisValueLabel
						}
						let value = '--'
						if (params[i].data !== null) {
							value = params[i].data
							// 保留两位小数
							if (formatFloat2) {
								value = this.formatFloat2(value)
							}
							// 添加千分位
							if (formatThousands) {
								value = this.formatThousands(value)
							}
						}
						// #ifdef H5
						result += '\n' + params[i].seriesName + ':' + value + ' ' + unit
						// #endif

						// #ifdef APP-PLUS
						result += '<br/>' + params[i].marker + params[i].seriesName + ':' + value + ' ' + unit
						// #endif
					}
					return result
				}
			},
			/**
			 * 保留两位小数
			 * @param {Object} value
			 */
			formatFloat2(value) {
				let temp = Math.round(parseFloat(value) * 100) / 100
				let xsd = temp.toString().split('.')
				if (xsd.length === 1) {
					temp = (isNaN(temp) ? '0' : temp.toString()) + '.00'
					return temp
				}
				if (xsd.length > 1) {
					if (xsd[1].length < 2) {
						temp = temp.toString() + '0'
					}
					return temp
				}
			},
			/**
			 * 添加千分位
			 * @param {Object} value
			 */
			formatThousands(value) {
				if (value === undefined || value === null) {
					value = ''
				}
				if (!isNaN(value)) {
					value = value + ''
				}
				let re = /\d{1,3}(?=(\d{3})+$)/g
				let n1 = value.replace(/^(\d+)((\.\d+)?)$/, function(s, s1, s2) {
					return s1.replace(re, '$&,') + s2
				})
				return n1
			}
		}
	}
</script>

<style lang="scss" scoped>
	.echarts {
		width: 100%;
		height: 100%;
	}
</style>接下来就可以在所需要使用echarts的页面上,在script内引入该组件,并注册该组件,注册完后你需要复制以下代码
import echarts from '@/components/echarts.vue';
export default {
	// 注册组件
	components: {
         echarts
	},
     data(){
         return{
             option:{}
         }
     },
     methods:{
        logstatrt() {
		// console.log('初次调用');
		this.option = {
			notMerge: true,
			backgroundColor": "#F8FAFF",
			tooltip: {
				trigger: 'axis',
				showContent: this.showContent,
				axisPointer: {
					type: 'shadow',
					label: {
    					show: true
					},
				},
			},
			toolbox: {
				padding: [200, 0, 0, 0],
				show: true,
				feature: { //工具配置项
    				mark: {
						show: true
					},
					dataView: { //数据视图工具,可以展现当前图表所用数据
						show: true, //是否显示该工具
						readOnly: false //是否不可编辑
					},
					magicType: {
						show: true, //是否显示该工具
						type: ['line', 'bar'] //启用的动态类型
					},
					restore: {
						show: true //是否显示该工具
					},
					saveAsImage: {
						show: true //是否显示该工具
						}
					}
				},
				calculable: false, //是否显示拖拽的手柄
				// itemHeight: 0,
    			legend: { //图例组件
					data: [{
						name: '进入数',
					}, {
						name: '出去数'
					}],
					itemGap: 24,
					padding: [16, 0, 0, 0],
					// y: 'bottom',
					itemHeight: 8, //高
					itemWidth: 8, //宽
					icon: 'circle' //设置为圆
				},
				grid: {
					top: '15%',
					left: '4%',
					right: '4%',
					bottom: '6%',
					containLabel: true
				},
				xAxis: [{
					show: true,
					type: 'category', //坐标轴类型
					// boundaryGap:false, //解决数据与线不对应问题
					data: ['7.1', '7.2', '7.3', '7.4', '7.5', '7.6', '7.7', '7.8', '7.9', '7.10','7.11' ],
					// offset:50,
					//['7.1', '7.2', '7.3', '7.4', '7.5', '7.6', '7.7', '7.8', '7.9', '7.10','7.11', ], //this.xList, //obama_budget_2012.names
					axisLabel: {
						color: '#7F84B5',
						fontWeight: 300,
						interval: 0,
						},
						axisTick: {
							show: false //刻度线
						},
						axisLine: {
							show: false, //不显示坐标轴线
						},
					}, ],
				yAxis: [{
					show: true,
					boundaryGap: false, //解决数据与线不对应问题
					type: 'value',
					// name: 'Budget (million USD)',
					// data: this.yList,
					minInterval: 1,
					axisLabel: {
						interval: 0,
					},
					splitLine: {
						show: true,
    					lineStyle: { //背景网格线
							type: 'dashed'
						}
					},
					axisTick: {
						show: false //刻度线
					},
					axisLine: {
						show: false, //不显示坐标轴线
					},
				}],
				dataZoom: [{
					show: false,
					start: 0,
					end: 100,
					handleSize: 8
				},
				{
					type: 'inside',
					start: 0,
					end: 50,
				},
				{
					show: false,
					yAxisIndex: 0,
    				filterMode: 'empty',
					width: 12,
					height: '80%',
					showDataShadow: false,
					left: '93%',
					handleSize: 8
				}
				],
				series: [{
					name: '进入数',
					type: 'bar',
					data: ['10', '20', '30', '40', '50', '60', '70', '80', '90', '100', '110','120'],
					//['10', '20', '30', '40', '50', '60', '70', '80', '90', '100', '110','120'], // this.inNum, //obama_budget_2012.budget2011List
					color: "#00B1FF"
				},
						{
							name: '出去数',
							type: 'bar',
							data: ['10', '20', '30', '40', '50', '60', '70', '80', '90', '100', '110','120'],
							//['10', '20', '30', '40', '50', '60', '70', '80', '90', '100', '110','120'], //this.outNum, //obama_budget_2012.budget2012List
							color: "#FF6C00"
						}
					]
				};
			},
     }
}好了,你已经离成功不远了!!
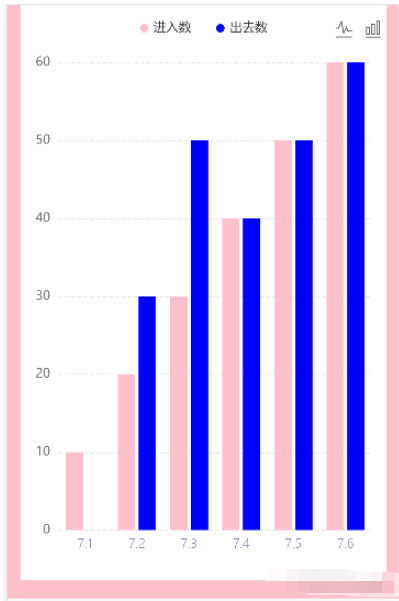
接下来我们到页面上使用该组件,我们要设置他的id,把option内的配置也给他传过去,该图的宽高也在上面设置好,你会发现,这个时候多了一个柱状图出来
<echarts :option="option" id="myChart" ></echarts>最后附上一张效果图
附:报错:this.echarts.setCanvasCreator is not a function 的解决办法
echarts.vue页面引起的 prors不能传递方法
将刚才定制的echarts.js文件引入进去
import * as echarts from '@/common/echarts.min.js';参数加this
this.ctx = wx.createCanvasContext(canvasId,this);

const query = wx.createSelectorQuery().in(this);也可以直接进去,注意修改echarts.js的路径
<template>
  <canvas v-if="canvasId" class="ec-canvas" :id="canvasId" :canvasId="canvasId" @touchstart="touchStart" @touchmove="touchMove" @touchend="touchEnd" @error="error"></canvas>
</template>

<script>
import WxCanvas from './wx-canvas';
import * as echarts from '@/common/echarts.min.js';

export default {
  props: {
    // echarts: {
    //   required: true,
    //   type: Object,
    //   default() {
    //     return echarts;
    //   }
    // },
    onInit: {
      required: true,
      type: Function,
      default: null
    },
    canvasId: {
      type: String,
      default: 'ec-canvas'
    },
    lazyLoad: {
      type: Boolean,
      default: false
    },
    disableTouch: {
      type: Boolean,
      default: false
    },
    throttleTouch: {
      type: Boolean,
      default: false
    }
  },
  onReady() {
    this.echarts = echarts;

    if (!this.echarts) {
      console.warn('组件需绑定 echarts 变量,例:<ec-canvas id="mychart-dom-bar" ' + 'canvas-id="mychart-bar" :echarts="echarts"></ec-canvas>');
      return;
    }

    console.log('echarts');
    console.log(this.onInit);

    if (!this.lazyLoad) this.init();
  },
  methods: {
    init() {
      const version = wx.version.version.split('.').map(n => parseInt(n, 10));
      const isValid = version[0] > 1 || (version[0] === 1 && version[1] > 9) || (version[0] === 1 && version[1] === 9 && version[2] >= 91);
      if (!isValid) {
        console.error('微信基础库版本过低,需大于等于 1.9.91。' + '参见:https://github.com/ecomfe/echarts-for-weixin' + '#%E5%BE%AE%E4%BF%A1%E7%89%88%E6%9C%AC%E8%A6%81%E6%B1%82');
        return;
      }

      if (!this.onInit) {
        console.warn('请传入 onInit 函数进行初始化');
        return;
      }

      const canvasId = this.canvasId;
      this.ctx = wx.createCanvasContext(canvasId,this);

      const canvas = new WxCanvas(this.ctx, canvasId);

      this.echarts.setCanvasCreator(() => canvas);

      const query = wx.createSelectorQuery().in(this);
      query
        .select(`#${canvasId}`)
        .boundingClientRect(res => {
          if (!res) {
            //setTimeout(() => this.init(), 200);
            return;
          }

          this.chart = this.onInit(canvas, res.width, res.height);
        })
        .exec();
    },
    canvasToTempFilePath(opt) {
      const { canvasId } = this;
      this.ctx.draw(true, () => {
        wx.canvasToTempFilePath({
          canvasId,
          ...opt
        });
      });
    },
    touchStart(e) {
      const { disableTouch, chart } = this;
      if (disableTouch || !chart || !e.mp.touches.length) return;
      const touch = e.mp.touches[0];
      chart._zr.handler.dispatch('mousedown', {
        zrX: touch.x,
        zrY: touch.y
      });
      chart._zr.handler.dispatch('mousemove', {
        zrX: touch.x,
        zrY: touch.y
      });
    },
    touchMove(e) {
      const { disableTouch, throttleTouch, chart, lastMoveTime } = this;
      if (disableTouch || !chart || !e.mp.touches.length) return;

      if (throttleTouch) {
        const currMoveTime = Date.now();
        if (currMoveTime - lastMoveTime < 240) return;
        this.lastMoveTime = currMoveTime;
      }

      const touch = e.mp.touches[0];
      chart._zr.handler.dispatch('mousemove', {
        zrX: touch.x,
        zrY: touch.y
      });
    },
    touchEnd(e) {
      const { disableTouch, chart } = this;
      if (disableTouch || !chart) return;
      const touch = e.mp.changedTouches ? e.mp.changedTouches[0] : {};
      chart._zr.handler.dispatch('mouseup', {
        zrX: touch.x,
        zrY: touch.y
      });
      chart._zr.handler.dispatch('click', {
        zrX: touch.x,
        zrY: touch.y
      });
    }
  }
};
</script>

<style scoped>
.ec-canvas {
  width: 100%;
  height: 100%;
  flex: 1;
}
</style>“uniapp如何引用echarts画柱状图”的内容就介绍到这里了,感谢大家的阅读。如果想了解更多行业相关的知识可以关注亿速云网站,小编将为大家输出更多高质量的实用文章!
亿速云「云服务器」,即开即用、新一代英特尔至强铂金CPU、三副本存储NVMe SSD云盘,价格低至29元/月。点击查看>>
免责声明:本站发布的内容(图片、视频和文字)以原创、转载和分享为主,文章观点不代表本网站立场,如果涉及侵权请联系站长邮箱:is@yisu.com进行举报,并提供相关证据,一经查实,将立刻删除涉嫌侵权内容。


 计算
计算 安全
安全 数据库
数据库 网络和加速
网络和加速 企业服务
企业服务


