本文小编为大家详细介绍“vue+antv怎么实现折线图”,内容详细,步骤清晰,细节处理妥当,希望这篇“vue+antv怎么实现折线图”文章能帮助大家解决疑惑,下面跟着小编的思路慢慢深入,一起来学习新知识吧。
之前使用的图表是echarts+highcharts两个常用图表的,现在的话因为项目需要和别的原因也接触使用了阿里的g2图表,感觉效果还是挺好的,在这里分享下
官网入口
第一:安装插件
npm install @antv/g2 --save第二:lineCharts.vue,注意,图表这类型的数据必须mouned赋值一次,watch监听到数据改变在赋值一次,因为这里绑定的数据传过来后并不会同时加载图表
<template>
  <div class="gcharts" :id="id"></div>
</template><script>
import G2 from '@antv/g2'
export default {
data () {
return {
chart: null
}
},
props: {
charData: {
type: Array,
default: function () {
return {
data: []
}
}
},
id: String
},
// 如果使用serverData传过来的静态数据 请使用mounted()方法 并注释掉watch
mounted () {
this.drawChart()
},
// 监听API接口传过来的数据 使用watch
// watch: {
// charData: function (val, oldVal) { // 监听charData,当发生变化时,触发这个回调函数绘制图表
// console.log('new: %s, old: %s', val, oldVal);
// this.drawChart(val);
// }
methods: {
drawChart() {
// 2019.03.30 更新 destory方法已被废弃
// this.chart && this.chart.destory()
this.chart = new G2.Chart({
container: this.id,
width: 1550,
height: 425
})
this.chart.source(this.charData)
this.chart.scale('value', {
min: 0
})
this.chart.scale('year', {
range: [0, 1]
})
this.chart.tooltip({
crosshairs: {
type: 'line'
}
})
this.chart.line().position('year*value')
this.chart.point().position('year*value').size(4).shape('circle').style({
stroke: '#fff',
lineWidth: 1
})
this.chart.render()
}
}
}
</script><style lang='less' scope>
.gcharts{
width:100%;
height:100%;
}
</style>第三:调用部分
<lineCharts :charData="lineData" :id="'chart1'"></lineCharts>import lineCharts from '@/components/gcharts/lineCharts'//g2绘图
components: {
lineCharts,
},
data () {
return {
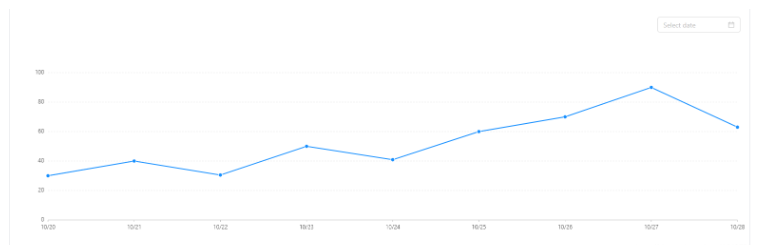
lineData:[
{year: '10/20',
value: 30
}, {
year: '10/21',
value: 40
}, {
year: '10/22',
value: 30.5
}, {
year: '10/23',
value: 50
}, {
year: '10/24',
value: 40.9
}, {
year: '10/25',
value: 60
}, {
year: '10/26',
value: 70
}, {
year: '10/27',
value: 90
}, {
year: '10/28',
value: 63
}]
}}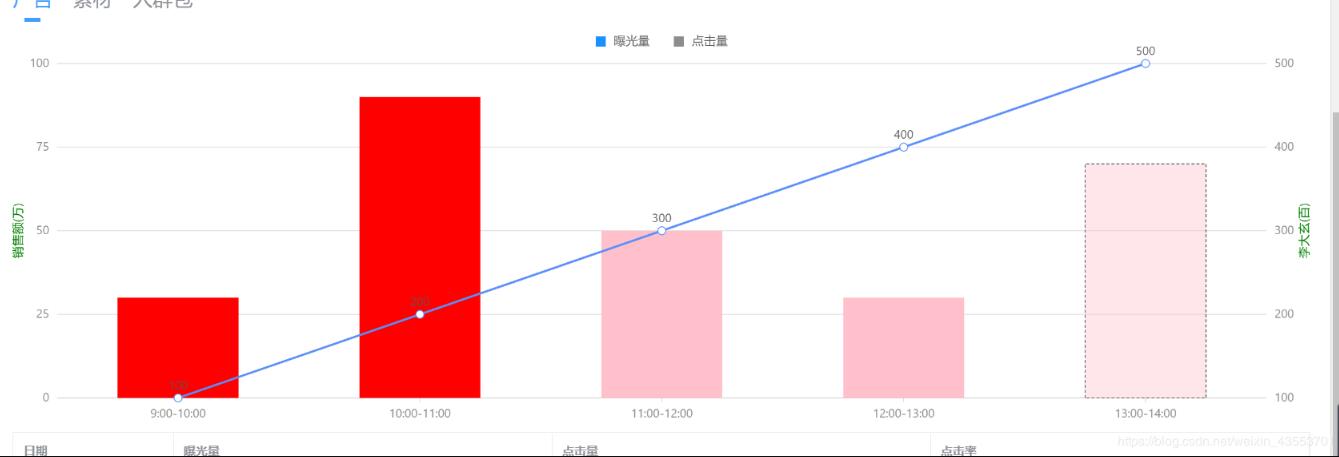
data: [
 { time: '9:00-10:00', value: 30 , type: '曝光量', rate: 100 },
   { time: '10:00-11:00', value: 90, type: '曝光量', rate: 200 },
   { time: '11:00-12:00', value: 50, type: '点击量', rate: 300 },
   { time: '12:00-13:00', value: 30, type: '点击量', rate: 400 },
   { time: '13:00-14:00', value: 70, type: '点击量', rate: 500 }
],<template>
<div class="page">
<div :id="id"></div>
</div>
</template><script type="text/ecmascript-6">
import { Chart } from '@antv/g2';
export default {
name: 'Name', // Pascal命名
components: {},
props: {
id: {
type: String,
default: 'chart'
},
height: {
type: Number,
default: 500
},
chartWidth: {
type: Number,
},
chartData: {
type: Array,
default: () => {}
},
},
data() {
return {};
},
computed: {},
watch: {},
filters: {},
beforeCreate() {},
created() {},
mounted() {
this.initPage();
},
methods: {
initPage() {},
drawChart() {
const _this = this;
const chart = new Chart({
container: _this.id,
autoFit: true,
height: _this.height,
width: _this.chartWidth
});
chart.data(_this.chartData);
chart.scale({
value: {
alias: '销售额(万)',
nice: true,
},
rate: {
alias: '李大玄(百)',
nice: true,
},
});
chart.axis('rate', {
title: {
top: '0',
style: {
fill: 'green',
},
},
});
chart.axis('value', {
title: {
top: '0',
style: {
fill: 'green',
},
},
});
chart.tooltip({
showCrosshairs: true, // 展示 Tooltip 辅助线
showMarkers: false,
shared: true,
});
chart.interaction('element-active');
chart.legend({
position: 'top',
items: [
{ name: '曝光量', value: '曝光量', marker: { symbol: 'square', style: { fill: '#1890FF', r: 5 } } },
{ name: '点击量', value: '点击量', marker: { symbol: 'square', style: { fill: '#8c8c8c', r: 5 } } },
],
});
chart
.interval()
.adjust('stack')
.color('type', ['red', 'pink'])
.position('time*value')
.style('time', val => {
if (val === '13:00-14:00') {
return {
fillOpacity: 0.4,
lineWidth: 1,
stroke: '#636363',
lineDash: [3, 2]
};
}
return {
fillOpacity: 1,
lineWidth: 0,
stroke: '#636363',
lineDash: [100, 0.5]
};
});
chart.line().position('time*rate').label('rate');
chart.point().position('time*rate');
// chart.interval().position('genre*sold');
// chart.intervalDodge().position('date*value').color('type');
chart.render();
}
},
};
</script><style lang="scss" scoped>
</style>读到这里,这篇“vue+antv怎么实现折线图”文章已经介绍完毕,想要掌握这篇文章的知识点还需要大家自己动手实践使用过才能领会,如果想了解更多相关内容的文章,欢迎关注亿速云行业资讯频道。
亿速云「云服务器」,即开即用、新一代英特尔至强铂金CPU、三副本存储NVMe SSD云盘,价格低至29元/月。点击查看>>
免责声明:本站发布的内容(图片、视频和文字)以原创、转载和分享为主,文章观点不代表本网站立场,如果涉及侵权请联系站长邮箱:is@yisu.com进行举报,并提供相关证据,一经查实,将立刻删除涉嫌侵权内容。


 计算
计算 安全
安全 数据库
数据库 网络和加速
网络和加速 企业服务
企业服务


