小编给大家分享一下C#绘制实时折线图波形图的方法,希望大家阅读完这篇文章后大所收获,下面让我们一起去探讨吧!
此Demo是采用VS自带的Chart图表控件,制作实时动态显示的折线图,和波形图。
涉及知识点:
Chart 控件,功能强大,可以绘制柱状图,折线图,波形图,饼状图,大大简化了对图的开发与定制。
Chart控件的相关概念:
Queue集合,表示先进先出的集合。
主要有两个方法:
Timer ,定时器,定时之行相应的功能,更新数据,刷新图表。
-----------------------------------------------------------------------------------------------------------
效果图
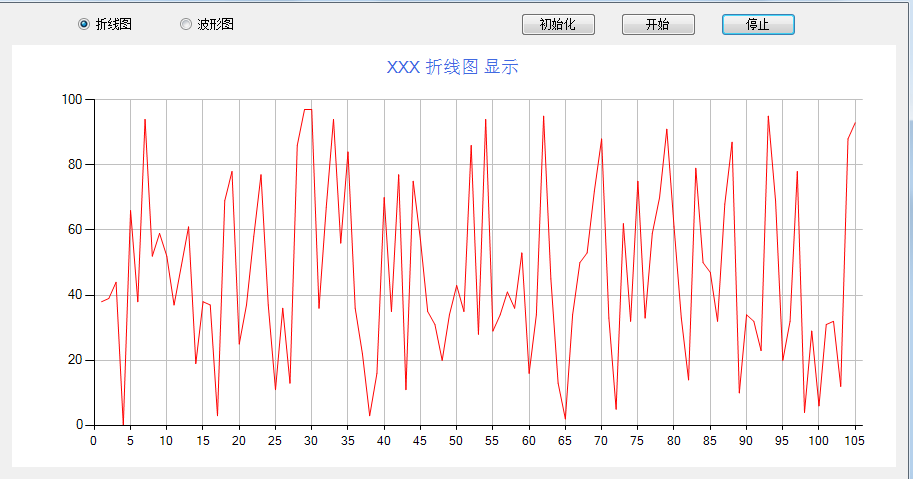
如下【先点击初始化按钮,再点击开始按钮】:
折线图【折线图,是取[0,100]之间的随即数进行填充】:
波形图【波形图,是取正玄值,并放大50倍,然后上移50】

核心代码
代码如下:
using System;
using System.Collections.Generic;
using System.ComponentModel;
using System.Data;
using System.Drawing;
using System.Linq;
using System.Text;
using System.Windows.Forms;
using System.Windows.Forms.DataVisualization.Charting;
namespace WindowsFormsApplication1
{
public partial class RealChart : Form
{
private Queue<double> dataQueue = new Queue<double>(100);
private int curValue = 0;
private int num = 5;//每次删除增加几个点
public RealChart()
{
InitializeComponent();
}
/// <summary>
/// 初始化事件
/// </summary>
/// <param name="sender"></param>
/// <param name="e"></param>
private void btnInit_Click(object sender, EventArgs e)
{
InitChart();
}
/// <summary>
/// 开始事件
/// </summary>
/// <param name="sender"></param>
/// <param name="e"></param>
private void btnStart_Click(object sender, EventArgs e)
{
this.timer1.Start();
}
/// <summary>
/// 停止事件
/// </summary>
/// <param name="sender"></param>
/// <param name="e"></param>
private void btnStop_Click(object sender, EventArgs e)
{
this.timer1.Stop();
}
/// <summary>
/// 定时器事件
/// </summary>
/// <param name="sender"></param>
/// <param name="e"></param>
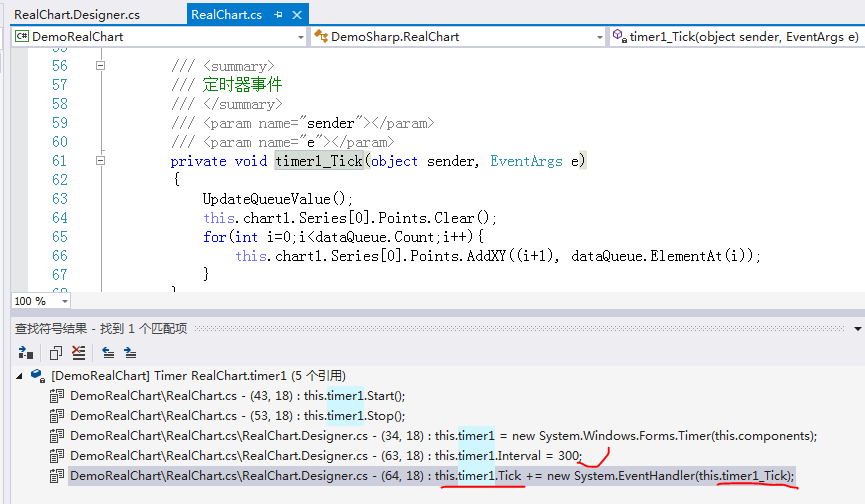
private void timer1_Tick(object sender, EventArgs e)
{
UpdateQueueValue();
this.chart1.Series[0].Points.Clear();
for(int i=0;i<dataQueue.Count;i++){
this.chart1.Series[0].Points.AddXY((i+1), dataQueue.ElementAt(i));
}
}
/// <summary>
/// 初始化图表
/// </summary>
private void InitChart() {
//定义图表区域
this.chart1.ChartAreas.Clear();
ChartArea chartArea1 = new ChartArea("C1");
this.chart1.ChartAreas.Add(chartArea1);
//定义存储和显示点的容器
this.chart1.Series.Clear();
Series series1 = new Series("S1");
series1.ChartArea = "C1";
this.chart1.Series.Add(series1);
//设置图表显示样式
this.chart1.ChartAreas[0].AxisY.Minimum = 0;
this.chart1.ChartAreas[0].AxisY.Maximum =100;
this.chart1.ChartAreas[0].AxisX.Interval = 5;
this.chart1.ChartAreas[0].AxisX.MajorGrid.LineColor = System.Drawing.Color.Silver;
this.chart1.ChartAreas[0].AxisY.MajorGrid.LineColor = System.Drawing.Color.Silver;
//设置标题
this.chart1.Titles.Clear();
this.chart1.Titles.Add("S01");
this.chart1.Titles[0].Text = "XXX显示";
this.chart1.Titles[0].ForeColor = Color.RoyalBlue;
this.chart1.Titles[0].Font = new System.Drawing.Font("Microsoft Sans Serif", 12F);
//设置图表显示样式
this.chart1.Series[0].Color = Color.Red;
if (rb1.Checked)
{
this.chart1.Titles[0].Text =string.Format( "XXX {0} 显示",rb1.Text);
this.chart1.Series[0].ChartType = SeriesChartType.Line;
}
if (rb2.Checked) {
this.chart1.Titles[0].Text = string.Format("XXX {0} 显示", rb2.Text);
this.chart1.Series[0].ChartType = SeriesChartType.Spline;
}
this.chart1.Series[0].Points.Clear();
}
//更新队列中的值
private void UpdateQueueValue() {
if (dataQueue.Count > 100) {
//先出列
for (int i = 0; i < num; i++)
{
dataQueue.Dequeue();
}
}
if (rb1.Checked)
{
Random r = new Random();
for (int i = 0; i < num; i++)
{
dataQueue.Enqueue(r.Next(0, 100));
}
}
if (rb2.Checked) {
for (int i = 0; i < num; i++)
{
//对curValue只取[0,360]之间的值
curValue = curValue % 360;
//对得到的正玄值,放大50倍,并上移50
dataQueue.Enqueue((50*Math.Sin(curValue*Math.PI / 180))+50);
curValue=curValue+10;
}
}
}
}
}备注
关于定时器Timer【微软自带的控件】:
说明:表示在相同的时间间隔,引发用户自定义的事情 。实现用户需要的功能。本例中是用来定时更新队列中的数据,并刷新图表。
常用说明:
看完了这篇文章,相信你对C#绘制实时折线图波形图的方法有了一定的了解,想了解更多相关知识,欢迎关注亿速云行业资讯频道,感谢各位的阅读!
免责声明:本站发布的内容(图片、视频和文字)以原创、转载和分享为主,文章观点不代表本网站立场,如果涉及侵权请联系站长邮箱:is@yisu.com进行举报,并提供相关证据,一经查实,将立刻删除涉嫌侵权内容。


